BITCOIN - A distribution toward 67K before a decline?BINANCE:BTCUSDT.P has transitioned from consolidation into a distribution phase following the breakout above resistance and is now advancing toward a key resistance zone within the broader bearish trend
The fundamental backdrop remains relatively weak for the cryptocurrency market. However, spot Bitcoin ETFs have recorded inflows for five consecutive trading sessions, providing short-term support for the current rally.
From a technical perspective, Bitcoin has broken above the 65,600 resistance level, and the momentum built during consolidation could drive price toward the 67,250 resistance zone. Nevertheless, given the prevailing higher-timeframe bearish trend, this area may act as a significant barrier and halt the advance
Resistance levels: 67,250
Support levels: 65,600, 63,800, 61,800
The broader market trend remains bearish. Price is approaching the key 67,250 resistance zone, where a short squeeze could shift momentum back in favor of sellers. If bears regain control at this level, Bitcoin could reverse and resume its primary downtrend toward 65,600, 63,800, and 61,800
Best regards,
R. Linda  Short
Short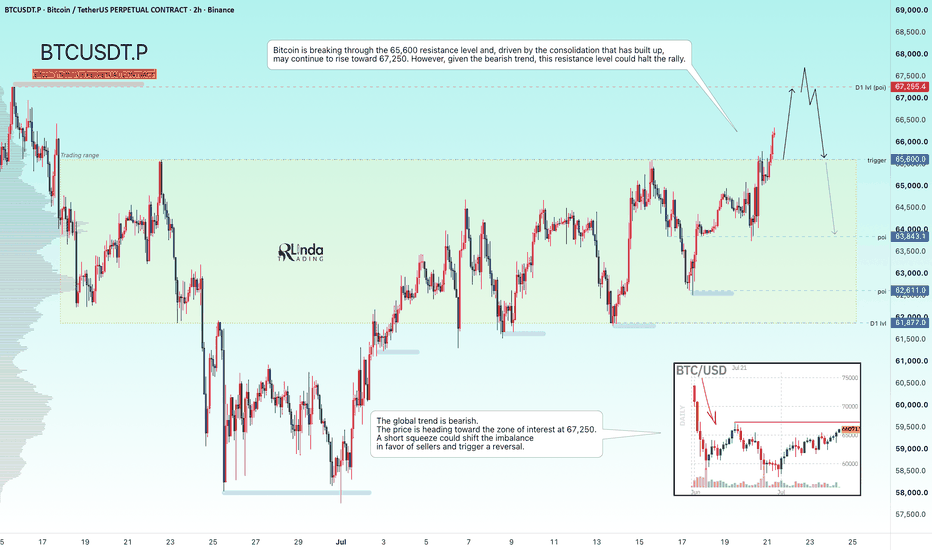
GOLD - A short squeeze before the decline continues toward 3900ICMARKETS:XAUUSD is hovering around the $4,000 mark on Monday, caught between bullish and bearish pressure as markets digest the ongoing escalation of tensions between the U.S. and Iran, while this week's U.S. economic calendar remains relatively light
The U.S. dollar remains in consolidation, although the Dollar Index (DXY) continues to maintain its broader bullish trend. Gold remains under pressure, and the daily technical outlook continues to favor the bears, limiting the potential for a sustained recovery. At this stage, there are few signs that this scenario will change in the near term.
Bearish drivers: Escalation of the U.S.–Iran conflict, supporting both the U.S. dollar and oil prices, Hawkish Federal Reserve rhetoric, Bearish technical market structure
Bullish drivers: Geopolitical de-escalation, Weaker-than-expected U.S. macroeconomic data, Profit-taking after recent declines
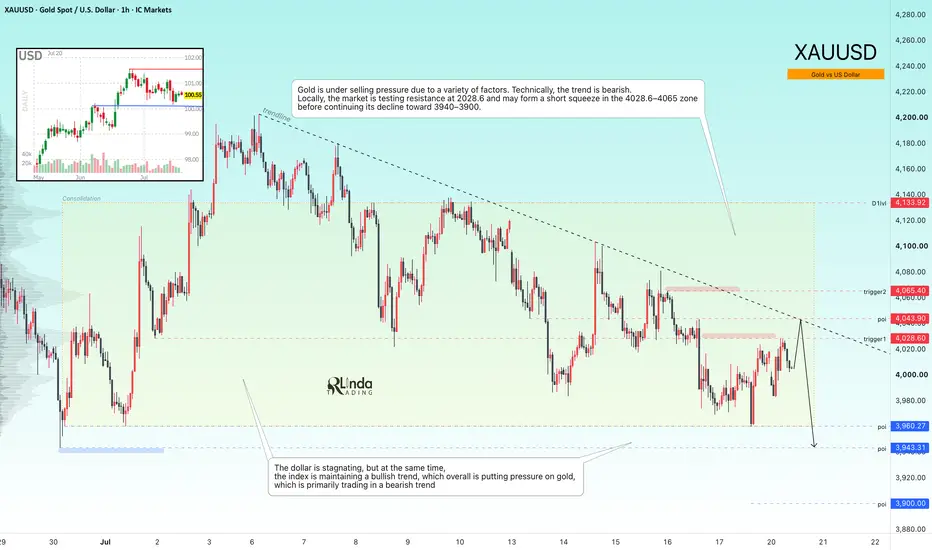
Resistance levels: 4028, 4043, 4065
Support levels: 3960, 3943, 3900
Gold remains under selling pressure due to a combination of technical and fundamental factors. The broader trend is still bearish. Technically, the market is confirming resistance around 4028.6, and a short squeeze into the 4028.6–4065 liquidity zone remains possible before the broader downtrend resumes toward 3940–3900
Best regards,
R. Linda  Short
Short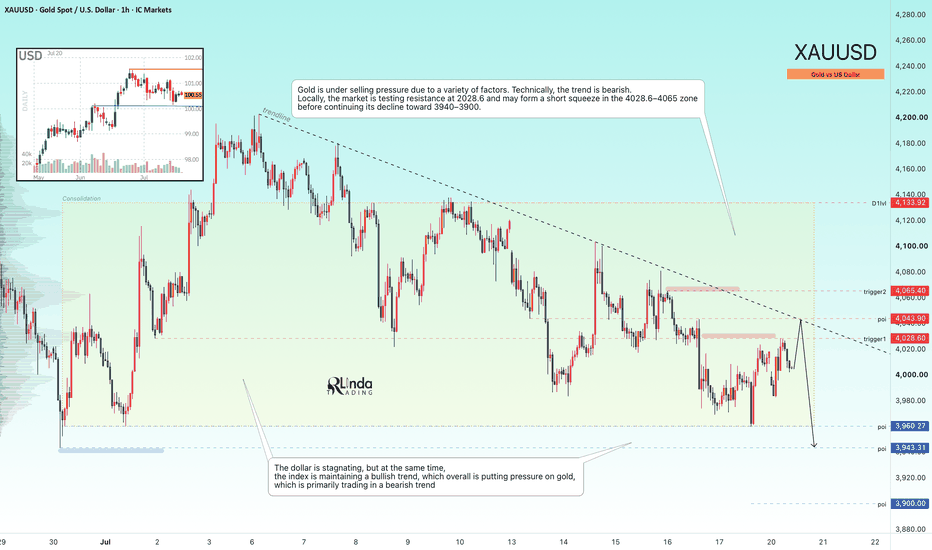
ETHUSDT - The Battle for a Key Support Zone BINANCE:ETHUSDT.P is showing local bullish momentum and appears stronger than Bitcoin in the current market environment. Price action is focused on the 1800–1850 zone, where buyers and sellers are competing for control
Bitcoin remains in consolidation between 61,000 and 65,000, while the broader market trend is still bearish. The lack of both fundamental and technical support continues to weigh on the crypto market as a whole.
From a technical perspective, Ethereum has broken above resistance, confirming a short-term bullish structure. During the ongoing correction, price is respecting the local trendline while testing the 1808–1848 area of interest
Resistance levels: 1848, 1946, 1966
Support levels: 1833, 1807, 1774
The key trigger remains 1848. If bulls can establish sustained consolidation above this level, it could become the technical catalyst for a move toward 1945–1966
Best regards,
R. Linda  Long
Long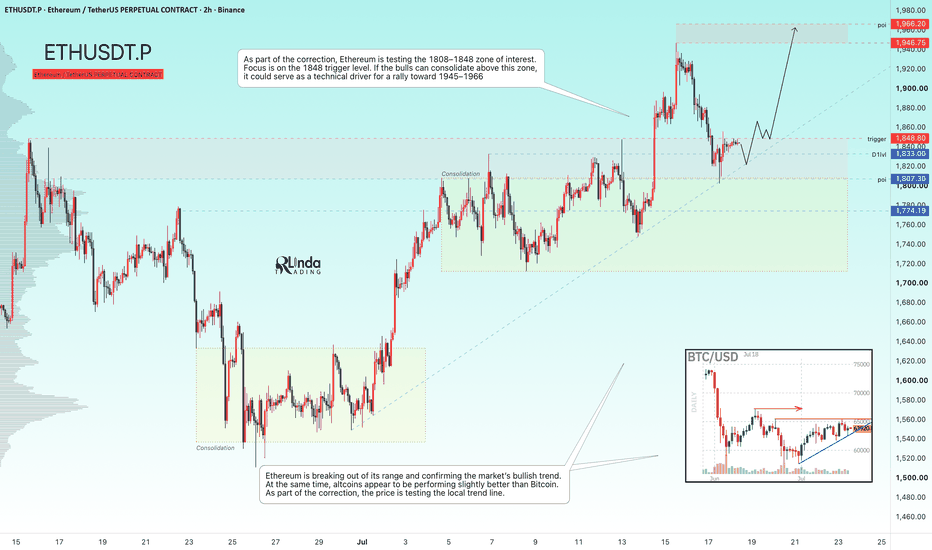
Dogecoin Daily Chart | Elliott Wave Analysis
At this stage, both the aggressive and conservative scenarios remain valid. Only future price action will determine which path the market ultimately chooses.
Aggressive Scenario
In the aggressive scenario, there is still a possibility that the market is developing a three-wave correction that could eventually evolve into a Double Three (W-X-Y) corrective structure.
Under this interpretation, the previous decline can be viewed as Wave W, followed by the recovery that formed Wave X. The current decline may represent only the initial phase of Wave Y, having already reached its most conservative target.
From here, the market may develop either a smaller corrective pattern or a more complex corrective structure around the current region or slightly lower. Ultimately, price action and the development of the following waves will determine whether Wave Y continues to unfold or whether the correction has already reached completion.
Conservative Scenario
In the conservative scenario, Wave X is interpreted as an Extended Leading Diagonal. In addition, the most recent three-wave advance currently displays the characteristics of a classic Zigzag, a structure that could mark the beginning of the next move in the direction of the larger trend.
If this interpretation proves to be correct, the correction may have already reached completion, allowing the market to gradually transition into the next bullish phase. However, as always, confirmation will only come through a breakout from the corrective structure, the ability of price to hold above the breakout level, and the development of a valid bullish pattern.
At this stage, neither scenario should be treated as certain. The market itself will determine the correct path. Until then, the structure, invalidation levels, and future price action remain our most reliable guide.
Patterns whisper. I listen.
— Mr. Nobody | Elliott Wave Principle
Dogecoin
2 days ago
Dogecoin (DOGE/USD) — A Long-Term Elliott Wave Perspective
Dogecoin
2 days ago
Dogecoin — The Structure of a Potential Golden Era
 Long
Long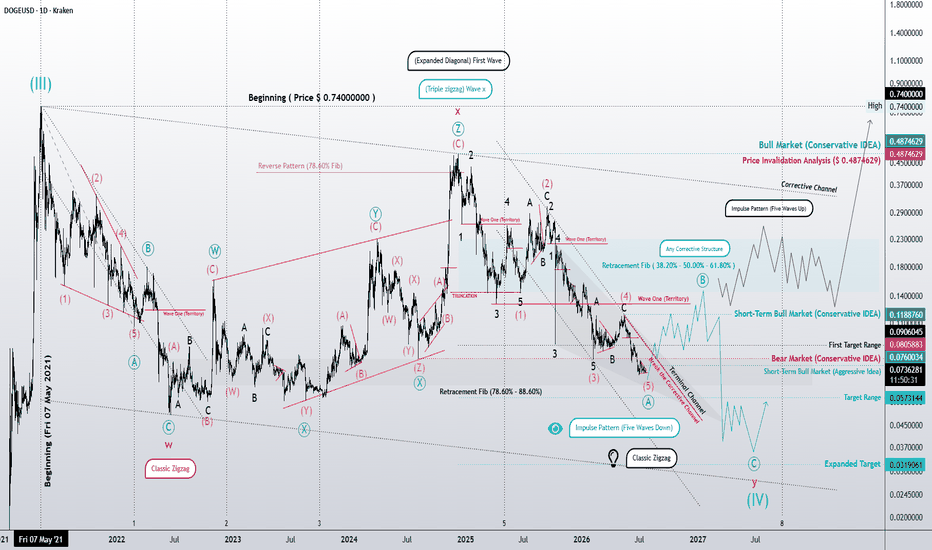
Short 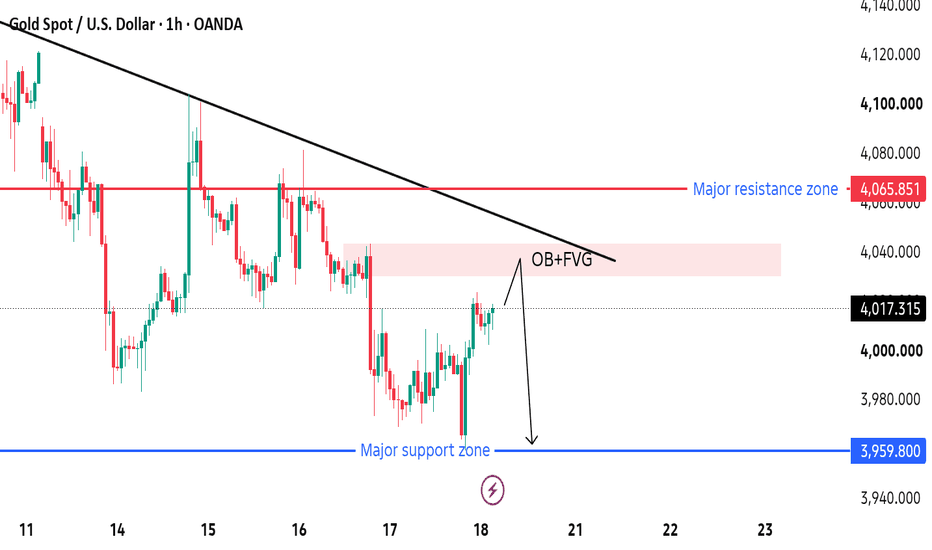
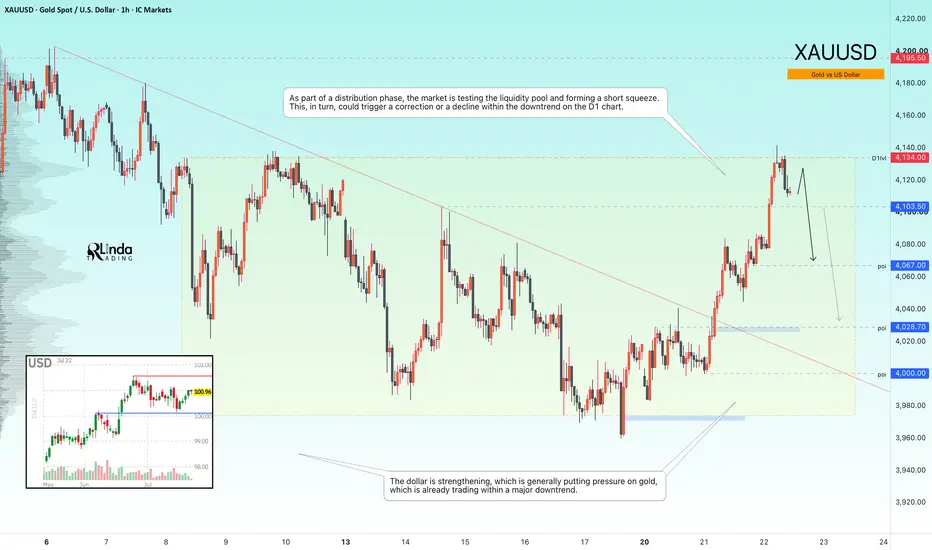
GOLD - A false breakout of resistance within a bearish trendICMARKETS:XAUUSD has broken out of its short-term descending channel within the current distribution phase and is now testing the 4134 liquidity zone while printing fresh intermediate highs. Despite the technical recovery, the broader fundamental backdrop remains weak
Gold remains caught between geopolitical support and pressure from hawkish Federal Reserve expectations and elevated real yields. Analysts note that a sustainable recovery would likely require lower oil prices, declining bond yields, and softer expectations for further monetary tightening. Until then, the upside potential is expected to remain limited.
At the moment, oil prices continue to rise, while the U.S. dollar has strengthened for a fifth consecutive session, maintaining its broader bullish trend.
Bullish drivers: Geopolitical de-escalation, Falling oil prices, A weaker U.S. dollar, Softer expectations for Fed rate hikes
Bearish drivers: Escalation of geopolitical tensions, Rising oil prices, Hawkish Fed rhetoric, Continued U.S. dollar strength
Resistance levels: 4124, 4134, 4195
Support levels: 4103, 4067, 4028
Technically, the market is testing a key liquidity pool within the current distribution phase and may be forming a short squeeze. If bears manage to keep price below the 4124–4134 resistance zone, it could trigger another leg lower in line with the broader daily bearish trend
Best regards,
R. Linda Short 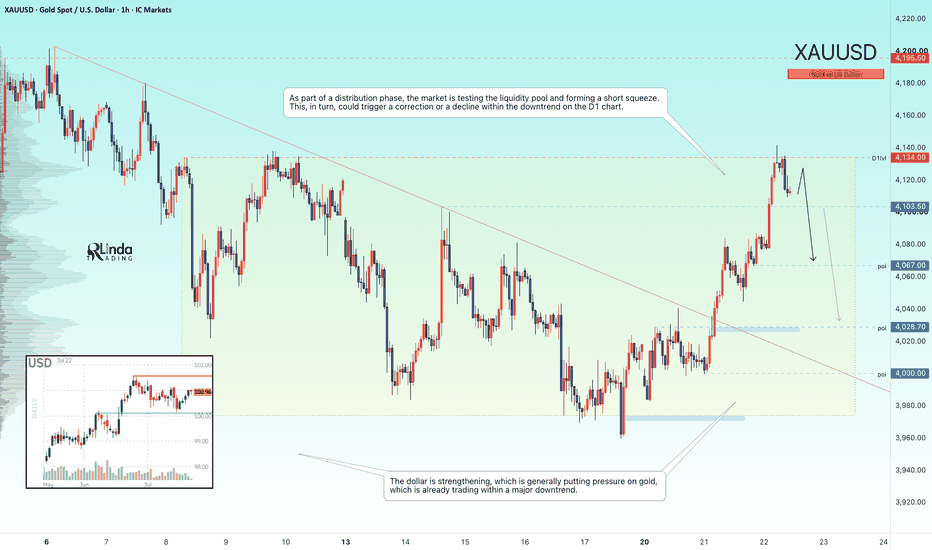
Elliott Wave Analysis – First Green Light for Bullish ContinuatiRBOB Gasoline (RB2!) 4H Chart | Elliott Wave Analysis – First Green Light for Bullish Continuation?
Under the aggressive scenario, the market has delivered its first encouraging signal that the bullish trend may be ready to continue. The breakout above the corrective channel, the completion of a Classic Zigzag, and the development of an initial five-wave advance all support the possibility that a new impulsive sequence has begun. If this wave count is correct, the current rally could represent only the early stage of a much larger bullish trend.
Even so, no market advances in a straight line. After every impulsive move, corrective structures are both natural and necessary, allowing the market to regain balance before the next leg higher. These pauses may develop as either price corrections or time corrections, both of which are consistent with Elliott Wave guidelines.
The next correction does not necessarily have to be deep. The market may simply enter a sideways corrective phase to consume time rather than price. Structures such as a Flat, Triangle, or even a Complex Correction remain entirely possible. These patterns typically allow the market to consolidate before the primary trend resumes.
The conservative scenario, however, still suggests that the market may require a larger correction before the primary bullish trend can fully develop. If the current decline unfolds as nothing more than a three-wave corrective structure, such as a Simple Zigzag, the probability of a larger corrective phase would increase.
That said, the presence of a three-wave correction alone is not enough to confirm the bearish case. The key will be the market's behavior once the correction is complete. If buyers fail to produce a new impulsive advance and price instead breaks below the corrective structure, it would become the first warning that a short-term bearish phase may be developing.
Finally, it is important to remember that RBOB Gasoline is one of crude oil's primary refined products and maintains a strong correlation with the oil market. As long as crude oil continues to preserve its bullish structure and extend higher, the broader outlook for gasoline is also expected to remain constructive.
For now, both scenarios remain valid. The market's future price action, wave structure, and reaction around key technical levels will ultimately determine which path gains confirmation.
Patterns whisper. I listen.
— Mr. Nobody  Long
Long
GOLD - The hunt for liquidity before the fall to 3900...FX:XAUUSD has completely unwound the bullish momentum generated by the recent news and has printed fresh local lows. The market remains in both a local and broader bearish trend, driven by persistent fundamental and geopolitical uncertainty
Gold continues to trade under pressure, with sellers firmly in control. The next key catalysts will be the U.S. Consumer Sentiment and Inflation Expectations reports. The technical outlook remains bearish, with price making new local lows while still holding above the key 3960 support area. Before the broader decline resumes, the market may enter a liquidity sweep phase, with downside potential extending toward 3940–3900.
Bearish drivers: Escalation of geopolitical tensions, Rising oil prices and a stronger U.S. dollar, Hawkish Federal Reserve rhetoric, Strong U.S. economic data
Bullish drivers: Geopolitical de-escalation, Weaker-than-expected consumer sentiment data, End-of-week profit-taking
Resistance levels: 4028, 4043, 4065
Support levels: 3960, 3943
The U.S. dollar remains in a strong bullish trend, reinforcing the bearish outlook for gold. Technically, the market is developing a breakout structure around the 3960–3940 support zone. A sustained break and close below this area could trigger another leg lower.
However, before the next sell-off, a short squeeze toward the 4028–4065 resistance zone remains possible. A false breakout of this area could attract fresh selling pressure and accelerate the broader downtrend
Best regards,
R. Linda Short 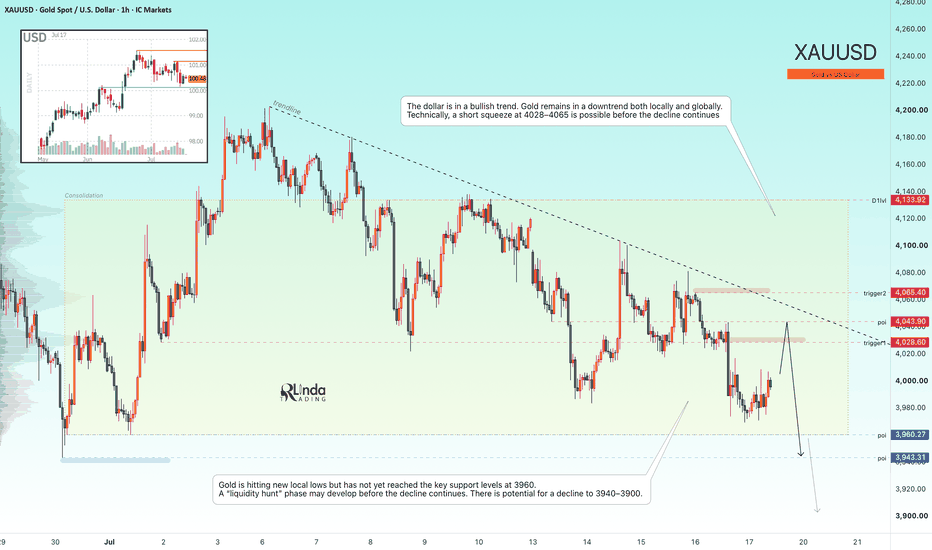
BITCOIN - A false breakout of resistance in a bear market BINANCE:BTCUSDT.P is forming a retest of the key 64,500 resistance level as part of a countertrend correction, trapping late buyers while the market remains in a liquidity sweep phase
The broader trend remains bearish. Unstable ETF flows, the lack of meaningful fundamental support, and ongoing geopolitical uncertainty continue to weigh on the market.
Within the broader bear market, the market maker has swept liquidity above 64,500 before pushing price back into the trading range. Bitcoin remains in a 62,000–65,000 consolidation zone, while the higher-timeframe trend continues to point lower. A short squeeze into the resistance area could trigger another sell-off toward the 60K–50K region
Resistance levels: 64,450, 64,700, 65,600
Support levels: 62,750, 61,300
A retest of the liquidity pool above 64,450 may attract renewed selling pressure. If bears successfully defend this key resistance zone, it would further confirm the prevailing bearish market structure and increase the probability of a decline toward 62,750 and 61,300
Best regards,
R. Linda Short 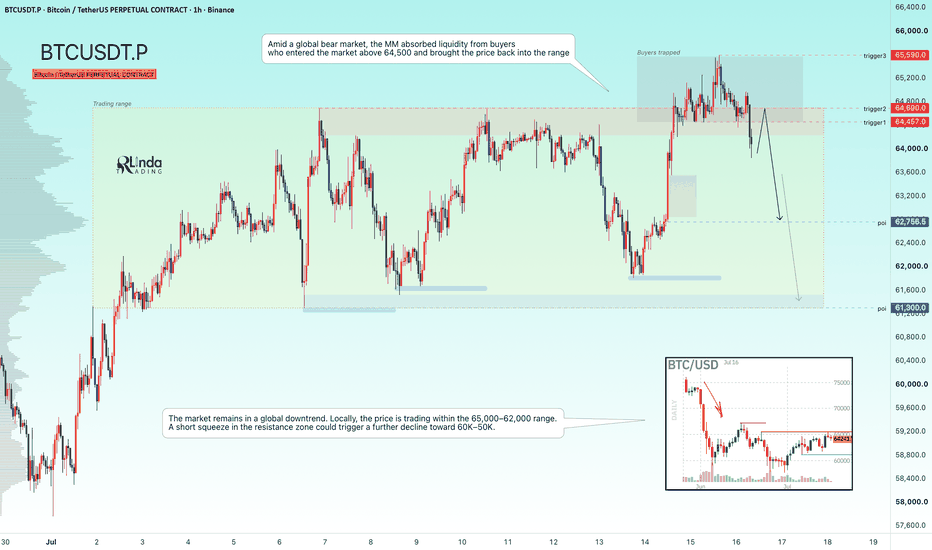
GOLD - Anticipating a short squeeze before the decline continuesICMARKETS:XAUUSD experienced a short squeeze around the key liquidity zone following Tuesday's CPI release. However, the market quickly regained its bearish momentum and resumed selling in line with the prevailing trend
The U.S. dollar remains in consolidation, as does the broader market, but the Dollar Index (DXY) continues to maintain its broader bullish trend, keeping pressure on gold. The lack of fundamental support, combined with ongoing geopolitical tensions, continues to favor the bears. The escalation of the U.S.–Iran conflict in the Strait of Hormuz remains a key source of uncertainty
Gold is still under pressure, with sellers maintaining control and using every rebound as an opportunity to initiate new short positions. The next major catalysts will be the U.S. Producer Price Index (PPI) and speeches from Federal Reserve officials, including Warsh. The daily technical structure remains bearish.
Bearish drivers : Escalation of the geopolitical conflict, Higher oil prices, Hawkish Fed rhetoric, Technical sell-on-rallies
Bullish drivers : Geopolitical de-escalation, Weaker-than-expected inflation data (including PPI), Dovish Fed commentary
Resistance levels: 4062, 4103
Support levels: 4021, 3986, 3960
Technically, gold is testing the 4021 intermediate support level. A local false breakdown could trigger a countertrend rebound toward the 4062 resistance zone to sweep liquidity before the broader downtrend resumes toward 3986–3960
Best regards,
R. Linda Short 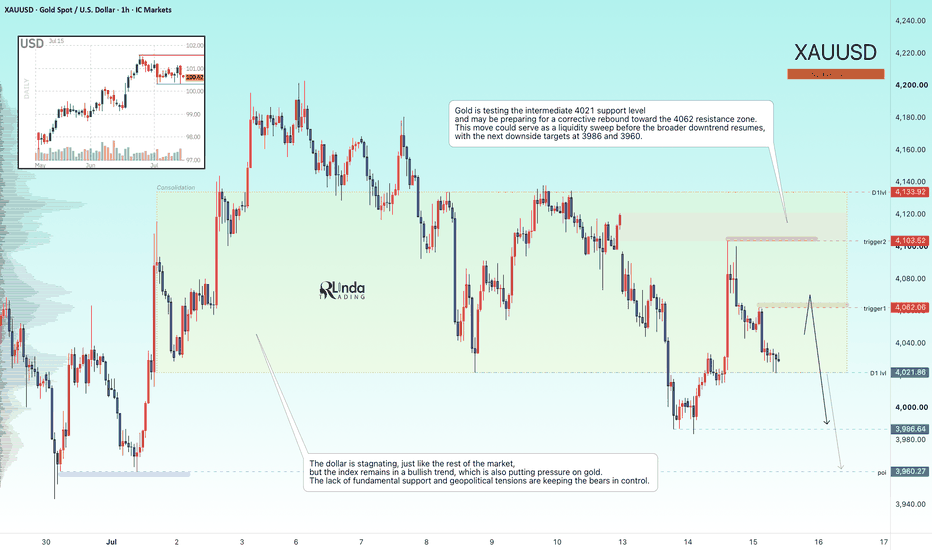
USDCAD - From consolidation to downward distributionFX:USDCAD is forming a reversal pattern following its recent strong rally. The market appears to be transitioning from a consolidation phase into a distribution phase
The U.S. dollar has entered a period of consolidation, while the Canadian dollar is beginning to strengthen, putting additional pressure on the pair.
After the strong advance, USDCAD moved into a 1.4150–1.4250 trading range. Instead of continuing higher, price is now showing signs of a reversal. Buyer participation may lead to a distribution phase, with the market potentially moving lower to fill the existing fair value gap (FVG)
Resistance levels: 1.4150, 1.4177
Support levels: 1.4092, 1.4024
Technically, after breaking below the consolidation support, bears are attempting to keep the price below the 1.4150 range boundary. As long as this level remains under sellers' control, the market may continue its decline toward 1.4092 and 1.4024
Best regards,
R. Linda BITCOIN - Retest of the 64,500 liquidity zone BINANCE:BTCUSDT.P remains within the 58,000–67,000 trading range, established as part of the broader bearish trend. Locally, the market is testing the upper boundary of the consolidation zone at 61,000–64,500, with the primary focus now on the resistance area
Bitcoin is currently caught between three major forces: the hawkish FOMC minutes, unstable ETF flows—with outflows resuming after three consecutive days of inflows—and ongoing geopolitical uncertainty. The market still lacks a strong fundamental catalyst. From a medium-term perspective, Bitcoin could decline toward 58K–50K before a potential long-term bottom is formed. The broader trend remains firmly bearish.
Technically, Bitcoin is advancing toward the 64,370–64,690 resistance zone. This move may represent a liquidity grab before another leg lower
Resistance levels: 64,370, 64,690
Support levels: 62,550, 61,300
Bitcoin is forming a countertrend correction into a key resistance zone, which also coincides with the upper boundary of the current trading range and a major liquidity pool. A short squeeze in this area could shift momentum back in favor of the bears, while consolidation below this resistance zone may trigger another decline toward 62,550 or the range support at 61,300
Best regards,
R. Linda Short 
EURUSD - Retest of support at 1.143–1.140 before distribution FX:EURUSD is showing early bullish signals. The pair is breaking above the 1.1434 resistance cluster and the descending trendline, opening the door for a potential continuation higher
The latest FOMC minutes did not deliver a clear hawkish message, with markets pricing in only a 25–30% probability of a July rate hike. Meanwhile, the 1.1400 support continues to provide a solid base for a technical rebound. However, renewed geopolitical tensions in the Middle East continue to support the U.S. dollar as a safe-haven asset
The ECB is widely expected to remain on hold in July, while the Fed still retains the option of another rate hike. Technically, the U.S. dollar is showing a limited reaction to recent news and appears vulnerable to a corrective pullback, which could provide additional support for the euro following the false breakout below support and the breakout above consolidation resistance
Resistance levels: 1.1477, 1.1528
Support levels: 1.1434, 1.1400
The pair is also confirming a false breakout below the major weekly (W1) support. The prolonged battle around 1.1400 highlights persistent buying interest. Locally, EURUSD is breaking above the 1.1434 consolidation resistance and the descending corrective trendline. If bulls can hold 1.1434 as new support, the pair could extend its advance toward 1.1478 and 1.1528
Best regards,
R. Linda GOLD - Breakdown from consolidation. Bearish pressureFX:XAUUSD failed to extend last week's rally despite the temporary improvement in the fundamental backdrop. Following yesterday's geopolitical escalation, market sentiment has shifted again, putting renewed pressure on the metal
Gold recovered modestly on Wednesday after its recent decline, but gains remain limited by the stronger U.S. dollar. Market attention is now focused on the minutes from the June FOMC meeting, which could provide further clues about the Fed's rate outlook.
Additional pressure comes from renewed tensions between the U.S. and Iran and rising oil prices, both of which have reinforced inflation concerns. As a result, markets have increased the probability of a September Fed rate hike to 63%. Gold's next move will likely depend on both the FOMC minutes and further developments in the Middle East
Resistance levels: 4123, 4133, 4195
Support levels: 4090, 4030, 3960
Technically, after breaking out of its consolidation range, gold is now forming a countertrend correction toward a liquidity zone while producing a false breakout above resistance. Bears are attempting to defend the 4120–4130 resistance area. A consolidation below 4120–4130 could trigger another decline toward 4090, 4030, and 3959, as selling pressure continues to build within both the local and the broader bearish trends
Best regards,
R. Linda Short 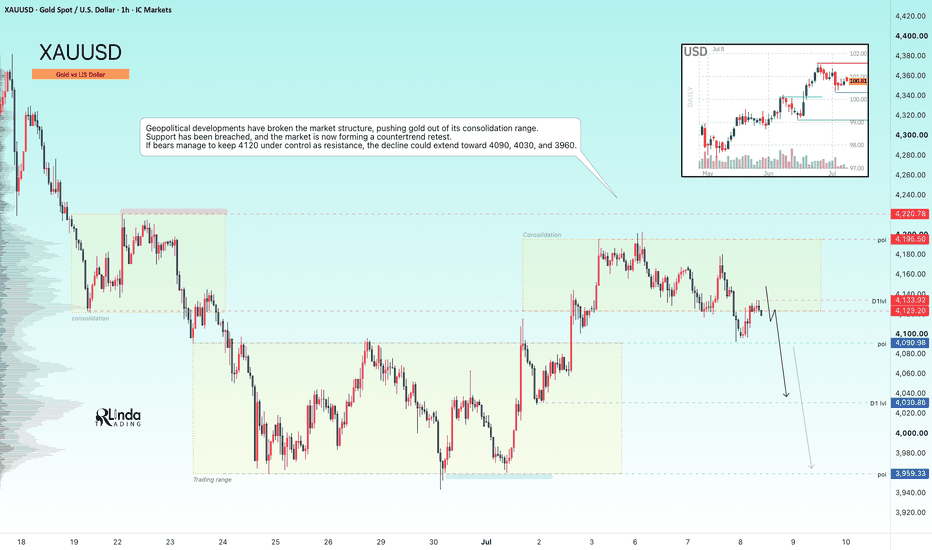
HYPEUSDT - Consolidation Before Further Growth BINANCE:HYPEUSDT.P is consolidating within both its local and global bullish trends. Technically, this phase appears to be a period of accumulation before a potential continuation of the uptrend
Bitcoin is currently caught between three major forces: the Fed's softer rhetoric, a reversal in ETF flows, and renewed geopolitical tensions in the Middle East. While Bitcoin remains in a countertrend correction within its broader bearish trend, HYPE continues to show relative strength. The market is forming two key trigger levels around the boundaries of the current trading range: 72.09 and 68.30
Resistance levels: 72.09, 77.00
Support levels: 68.30, 65.60
Technically, two scenarios remain in focus before the next bullish leg. The first is a retest of resistance followed by a breakout, where consolidation and a close above 72.09 could trigger further upside. Alternatively, the market may first perform a long squeeze below the 68.30 support level before resuming its upward trend
Best regards,
R. Linda  Long
Long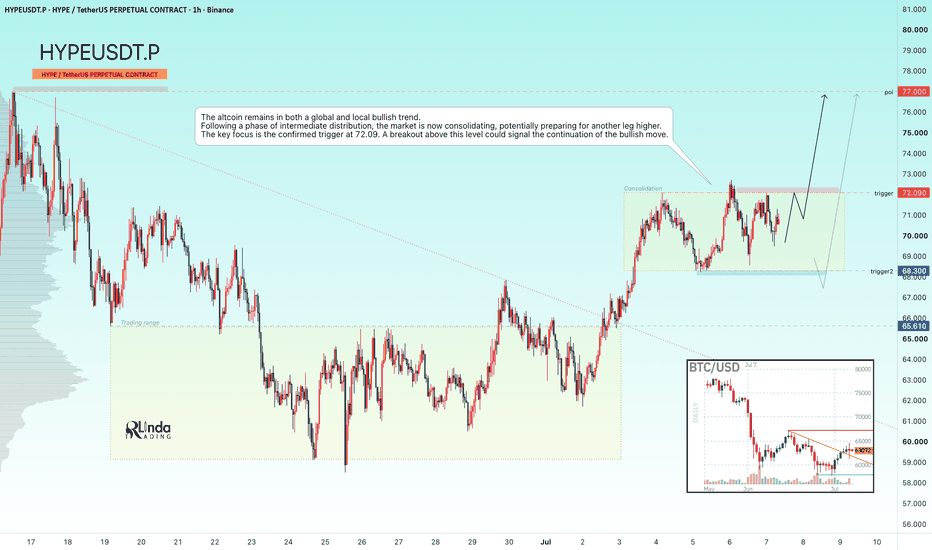
GOLD - A pullback before a potential rise to 4220 Following the breakout above the 4100 consolidation range and the recent rally, ICMARKETS:XAUUSD has entered a corrective phase. The geopolitical and fundamental backdrop remains unstable
Gold staged a strong recovery after weaker-than-expected U.S. employment data shifted Fed expectations from hawkish to more neutral. The probability of a September rate hike has fallen from 66% to around 53–55%, while the U.S. dollar has stalled and Treasury yields have declined, creating favorable conditions for a rebound after gold's sharpest quarterly drop in years.
However, with the start of the new trading week, gold has temporarily lost momentum due to renewed geopolitical developments. Market attention is now focused on headlines from the Middle East and the return of liquidity following the U.S. holiday weekend.
Key drivers:
Bearish for gold: stronger U.S. dollar, renewed geopolitical risks, profit-taking after the recent rally.
Bullish for gold: weaker U.S. dollar, progress in geopolitical negotiations, and the return of market liquidity after the U.S. holidays
Resistance levels: 4198, 4220
Support levels: 4144, 4121, 4095
Technically, market makers may target a retest of the 4198–4220 liquidity zone and the recent swing high. However, both the Asian and European sessions are currently favoring a corrective move and a liquidity hunt before another potential rally. A long squeeze into the 4144–4121 support zone could trigger another bullish impulse.
However, keep in mind that both the local and the broader market trends remain bearish.
Best regards,
R. Linda Long 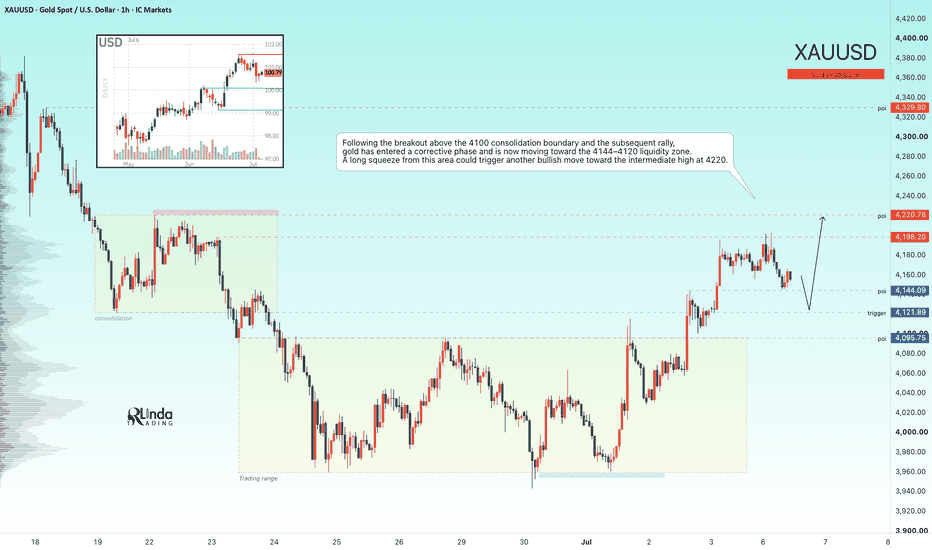
GOLD - A shift in the fundamental backdrop. Locally bullishFX:XAUUSD is breaking its recent market structure and transitioning into a local distribution phase within the broader bearish trend. The primary focus is on the 4120–4200 range
Gold has staged a strong rebound after weaker-than-expected U.S. employment data shifted Fed rate expectations from hawkish to neutral. The probability of a rate hike at the next meeting has fallen to 18%, while the U.S. dollar and Treasury yields have both declined, creating favorable conditions for a recovery following gold's sharpest quarterly decline in 13 years.
With the July 4th holiday approaching, profit-taking could increase volatility. Although bearish pressure has eased, the broader technical outlook remains cautious.
Technically, after the short squeeze into the 4190–4200 liquidity zone, gold may enter a corrective phase toward support before attempting another move higher. However, both the global and local trends remain bearish
Resistance levels: 4198, 4220, 4329
Support levels: 4150, 4125, 4061
A correction and retest of the 4130–4120 liquidity zone could provide bulls with another opportunity to push the market higher. Market makers may target a retest of 4220, with a potential medium-term extension toward 4330
Best regards,
R. Linda Long 
Is the Leading Diagonal Completing Wave A Before the Next RallySilver Elliott Wave Analysis (XAGUSD) | Is Wave A Near Completion Before a Classic Zigzag Correction?
Financial markets reward discipline—not certainty.
Every price movement reflects collective market psychology, and the Elliott Wave Principle provides a structured framework for studying that behavior through objective market structure.
This analysis is based on Elliott Wave rules, guidelines, Fibonacci relationships, channel analysis, and price action—not prediction.
Ultimately, the market will determine which scenario unfolds.
Primary Structural Scenario
My primary scenario interprets the current decline as a Leading Diagonal, potentially forming Wave A of a larger Wave IV correction.
So far, the internal structure continues to respect Elliott Wave rules and guidelines.
From a Fibonacci perspective, Wave (3) has advanced only approximately 61.8% of the length of Wave (1).
Meanwhile, Wave (5) has already exceeded both the 61.8% and 78.6% Fibonacci projections of Wave (3), leaving equality with Wave (3) as the final remaining Fibonacci objective.
Because of this relationship, one final decline cannot be ruled out before the Leading Diagonal is fully completed.
As long as price respects the initial invalidation level, this wave count remains technically valid.
What Could Happen Next?
If the Leading Diagonal completes as expected, I anticipate the beginning of Wave B, most likely developing as a three-wave corrective rally.
Until price proves otherwise, I will continue treating every bullish move as corrective rather than the beginning of a new impulsive uptrend.
Should Wave B remain below the previous major high while maintaining a corrective structure, the probability of an impulsive Wave C completing the larger Wave IV Zigzag correction would increase significantly.
Only after the completion of Waves A-B-C would I begin monitoring the potential development of Wave V.
Gold and Silver Correlation
Gold and Silver have historically maintained a strong positive correlation, although they rarely move in perfect synchronization.
Silver often demonstrates greater volatility and, at important turning points, can occasionally lead Gold.
For that reason, I continuously evaluate both markets together rather than in isolation.
If both markets confirm similar Elliott Wave structures, confidence in the larger scenario naturally increases.
What Should Aggressive Traders Watch?
The current 15-minute price action deserves close attention.
At this stage, the market may still be developing either:
Three nested 1–2, 1–2, 1–2 sequences, suggesting another decline before the correction begins, or
The final subdivision of the current Leading Diagonal, signaling that Wave A is approaching completion.
Until one of these structures is confirmed, every corrective move should be evaluated according to its own degree while respecting the initial invalidation level.
Patience remains one of the most valuable trading tools.
Allow the market to complete the first impulsive move and its following correction before drawing larger conclusions.
My Analytical Philosophy
My objective is not to predict the market.
My objective is to identify the structure the market is building.
If this scenario is confirmed, the analysis has fulfilled its purpose.
If market structure changes, my wave count will change with it—without hesitation and without emotional attachment.
In Elliott Wave analysis, flexibility is not weakness.
It is respect for objective market evidence.
Risk Management Comes First
The market has no sympathy for undisciplined traders.
It rewards patience, respects discipline, and punishes emotional decisions without exception.
Our responsibility does not end after entering a position.
Our responsibility is to minimize risk, protect capital, and preserve profits whenever the market provides the opportunity.
Because in the end...
The market always has the final word.
Facts always win.
Final Thoughts
This publication represents an independent Elliott Wave study based entirely on objective market structure.
It is not financial advice, nor a promise that this scenario will unfold exactly as presented.
The market owes us nothing.
Our responsibility is simply to follow the structure, respect the rules, and adapt whenever new information appears.
That is the essence of Elliott Wave analysis.
"Patterns whisper. I listen."
— Mr. Nobody 🎧📊  Long
Long
Is the Leading Diagonal Signaling the Beginning of Wave IV?Gold Elliott Wave Analysis (XAUUSD) | Is the Leading Diagonal Signaling the Beginning of Wave IV?
Financial markets reward discipline—not certainty.
Every price movement reflects collective market psychology, and Elliott Wave Principle provides a structured framework for studying that behavior. My objective is not to predict the future, but to evaluate market structure through Elliott Wave rules, guidelines, Fibonacci relationships, channel analysis, and price action.
The market will ultimately determine which scenario is correct.
The Aggressive Scenario
The aggressive scenario interprets the current decline as a Leading Diagonal, a structure whose internal wave relationships continue to respect Elliott Wave rules and guidelines.
Within this interpretation, Wave (3) is approximately equal in length to Wave (1), while Wave (5) has advanced only about 61.8% of Wave (3). These Fibonacci relationships strengthen the possibility that the diagonal is approaching completion rather than extending further.
Since no Elliott Wave rule has been violated, the initial invalidation level remains the most important price reference for this scenario.
What Could Happen Next?
If this interpretation proves correct, I expect the market to begin a sharp corrective rally, most likely developing at least a three-wave recovery before another decline unfolds to complete a larger classic Zigzag correction (Wave IV).
However, one additional possibility should not be ignored.
The final subdivision of the current Leading Diagonal may still require one more decline before the structure is fully completed, allowing price to reach the downside target area highlighted on the chart.
For that reason, patience remains essential.
Rather than anticipating every price movement, I prefer waiting for the first completed impulsive wave, followed by its corrective structure. Only then can the market confirm whether the larger Wave IV correction has truly begun.
What Should Aggressive Traders Watch?
The current price action on the 15-minute timeframe deserves close attention.
At this stage, the market may still be developing either:
Three nested 1–2, 1–2, 1–2 sequences, suggesting further downside before a reversal, or
A nearly completed Leading Diagonal, signaling that a corrective rally could begin soon.
Until one of these structures is confirmed, every corrective move should be evaluated relative to its own degree while respecting the initial invalidation level shown on the chart.
My Analytical Approach
My objective is not to predict the market.
My objective is to identify the structure the market is building.
If price confirms this scenario, the analysis has served its purpose.
If market structure changes, my wave count will change with it—without hesitation and without emotional attachment.
In Elliott Wave analysis, flexibility is not weakness.
It is respect for objective market evidence.
Risk Management Comes First
The market has no sympathy for undisciplined traders.
It rewards patience, respects discipline, and punishes emotional decisions without exception.
Our responsibility as traders does not end after entering a position.
Our real responsibility is to minimize risk, protect capital, and preserve profits whenever the market provides the opportunity.
The market always has the final word.
Final Thoughts
This analysis represents a research-based interpretation of the current market structure using Elliott Wave Principle.
It is not financial advice, nor a prediction of future prices.
Like every wave count, it remains valid only as long as market structure supports it.
When the structure changes, the analysis must change with it.
Because in financial markets...
Facts always win.
"Patterns whisper. I listen."
— Mr. Nobody 🎧📊 Long 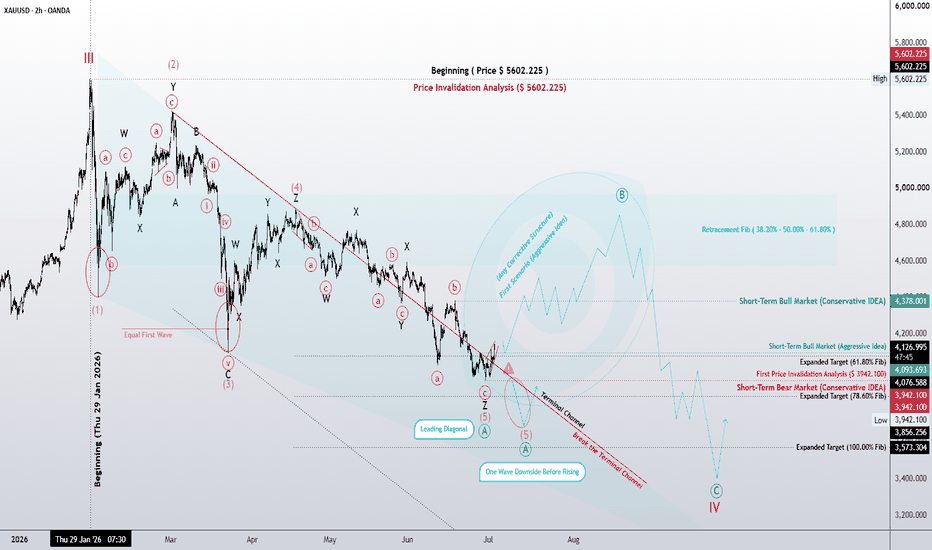
BITCOIN - A false breakout of resistance during a bearish trendBINANCE:BTCUSDT.P remains in a bearish trend and is currently retesting the 60700 resistance zone. Both the global and local trends continue to favor the downside.
Bitcoin is caught between three key forces: the Fed's softer rhetoric (Kevin Warsh signaled easing inflation risks, reducing pressure on risk assets), record institutional outflows (the tenth consecutive day of ETF outflows, with $4.5 billion withdrawn in June), and a countertrend correction within the broader bearish trend.
Technically, the market is showing signs of a false breakout around resistance as sellers attempt to defend the area. Consolidation below 60700 could trigger another leg lower.
Resistance levels: 60700, 62200
Support levels: 59555, 58320, 58030
The focus remains on two key trigger levels: 60730 and 62232. If the market fails to reclaim 60730 after the false breakout, Bitcoin could resume its decline toward 59500–58000. However, a retest of the 62200 resistance zone cannot be ruled out. A short squeeze into either resistance area could create the conditions for another bearish move.
Best regards,
R. Linda Short 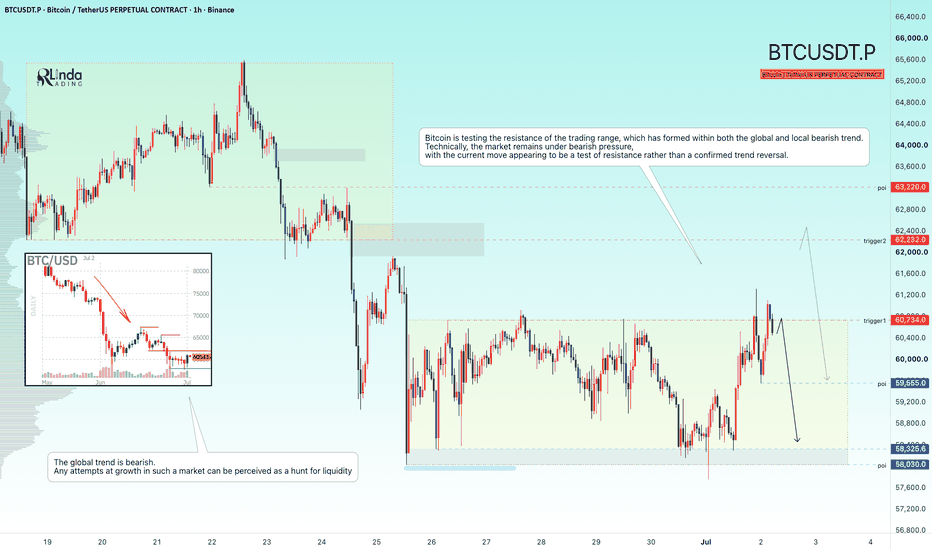
GOLD - Consolidation amid a bearish trend ICMARKETS:XAUUSD remains in both a global and local bearish trend. Within the broader downtrend, the market is consolidating, with price action suggesting a potential continuation lower. The key range to watch is 3959–4018–4090
Gold continues to trade under pressure. The main event in focus is Fed Chair Kevin Warsh's speech at the ECB Forum in Sintra. His comments could either reinforce or challenge the Fed's recent hawkish stance.
The U.S. dollar continues to strengthen amid renewed U.S.–Iran tensions, hawkish Fed rate expectations, and USDJPY climbing to multi-decade highs. Together, these factors continue to weigh on gold.
Key drivers:
Bearish: stronger U.S. dollar, rising Treasury yields, hawkish Fed signals, ongoing geopolitical uncertainty.
Bullish: progress in geopolitical negotiations, weaker U.S. economic data, or a dovish shift from the Fed
Resistance levels: 4018, 4090, 4121
Support levels: 3959, 3886, 3819
Gold remains in a well-defined bearish structure on both the local and higher timeframes. The preferred trading bias remains to the downside, with 3959 and 4018 serving as the key trigger levels. Price is consolidating around 3959, while the reaction from buyers is gradually weakening. A breakdown below support—or a short squeeze into 4018—could trigger the next impulsive move lower
Best regards,
R. Linda Short 
EURJPY - A Breakthrough of Resistance to Continue the Uptrend FX:EURJPY is testing the 184.84 support level after breaking above a key resistance. The broader trend remains bullish, providing overall support for further upside
EURJPY is currently influenced by three major factors: a widening interest rate differential in favor of the euro, persistent bearish positioning on the Japanese yen as large speculators continue to increase short exposure, and growing risks of a Japanese currency intervention amid the yen's weakest levels in decades. Despite these factors, the technical structure remains favorable for further gains.
The chart is forming a classic breakout pattern, with price holding above the former resistance level
Resistance levels: 185.37, 186.32
Support levels: 184.84, 184.57
Following a pullback from 185.37, the pair is testing the 184.84 support and liquidity zone. Within the broader bullish trend, if bulls manage to defend this trigger level, it could pave the way for another leg higher
Best regards,
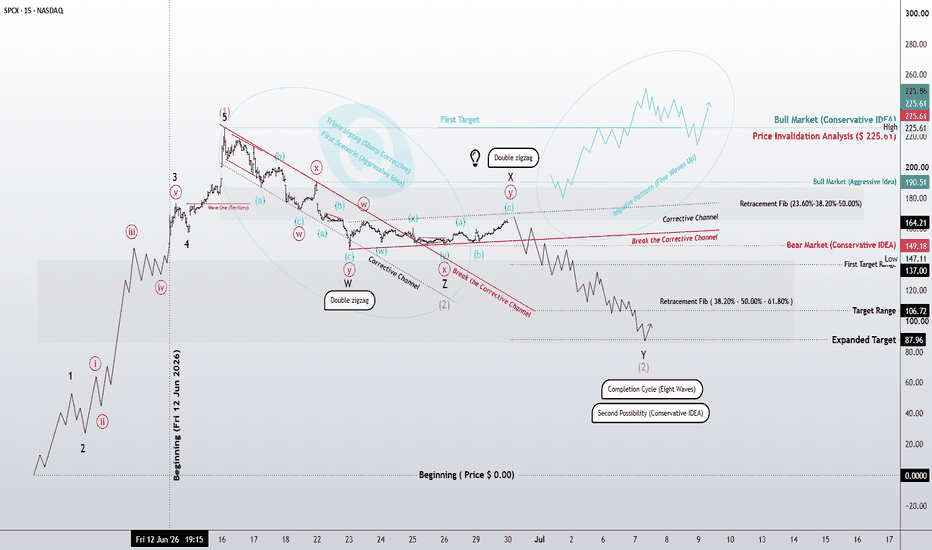
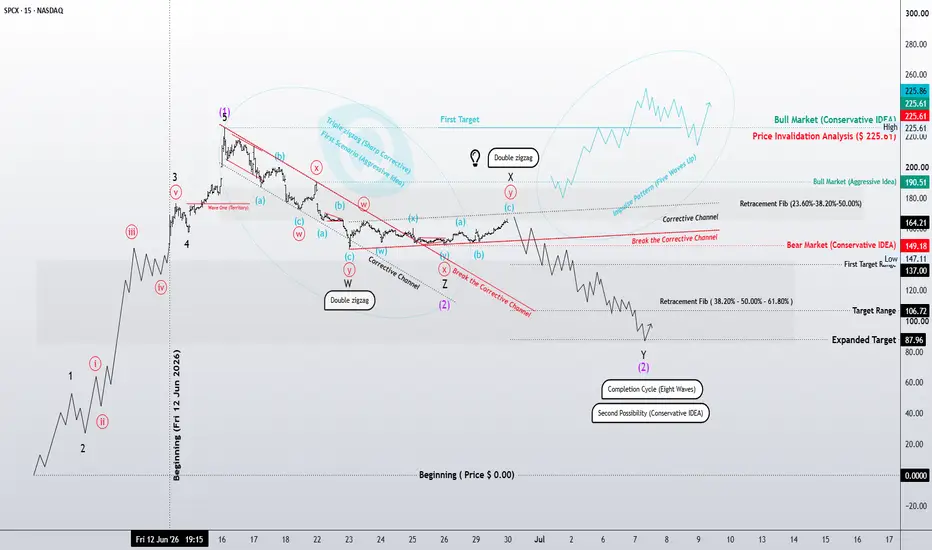
R. Linda SPCX Elliott Wave AnalysisDouble Zigzag Completed or One More Leg Down Before Wave 3?
SPCX is a newly listed Nasdaq stock with a limited price history, making its wave structure much easier to monitor than older, more complex charts. Since there isn't enough historical data to rely on long-term market cycles, Elliott Wave analysis and price action currently provide one of the clearest frameworks for evaluating the next major move.
As always, this analysis presents probabilities rather than certainties. The market will ultimately decide which scenario becomes valid.
This idea was shared previously, and so far the primary wave count remains intact.
After printing a high at $225.61, price entered a corrective phase. My primary count labels the decline as a Double Zigzag (W-X-Y) consisting of seven swings. The current recovery also appears to be developing as another corrective structure from the Zigzag family, with the potential to evolve into a Triple Zigzag if additional complexity is required.
Should this scenario play out, I expect one more decline after the current correction completes, allowing price to finish a larger corrective sequence and complete the overall eight-wave cycle shown on the chart. The highlighted support zones represent the most likely areas where this correction could terminate.
However, there is another scenario that deserves equal attention.
The entire decline may have already completed as a Triple Zigzag, meaning the market could now be building a series of nested 1-2, 1-2, and 1-2 structures across multiple degrees. If that interpretation proves correct, a confirmed breakout above $225.61, followed by a healthy pullback, would significantly increase the probability that SPCX is entering a higher-degree Wave (3)—typically the strongest and most impulsive phase of an Elliott Wave cycle.
For now, both scenarios remain valid.
The key confirmation level is $225.61. A decisive break above this high would strongly favor the bullish count, while rejection below it would keep the larger corrective structure in play.
As always, let the market confirm the wave count—not the other way around.
Key Levels
🔹 Bullish Confirmation: Above $225.61
🔹 Current Bias: Neutral until confirmation
🔹 Primary Structure: Double Zigzag
🔹 Alternate Structure: Triple Zigzag → Nested 1-2 setup
🔹 Focus: Watch the corrective channel and market reaction around key resistance.
Patterns whisper. I listen.
— Mr. Nobody 🎧📊
Space Exploration Technologies Corp.
3 days ago
SpaceX: Impulsive Breakout or Structural Correction?
 Short
Short