Market Structure & Scatter Dashboard [LuxAlgo]
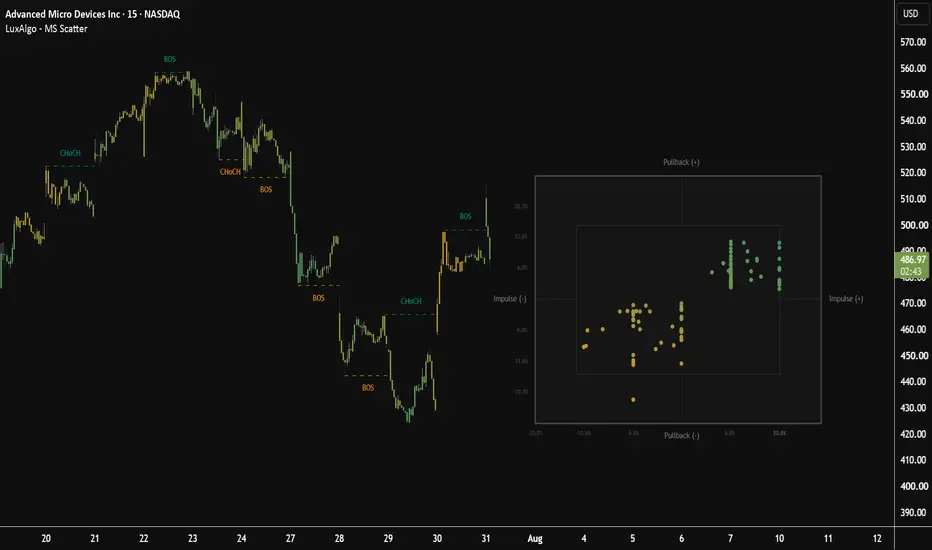
The Market Structure & Scatter Dashboard indicator provides a comprehensive view of price action by combining automated market structure mapping with a dynamic scatter plot analysis. It aims to quantify the relationship between impulse moves and subsequent pullbacks to help traders understand the current volatility and trend strength.
🔶 USAGE
The script identifies key structural points and visualizes the relationship between the magnitude of price expansions and their retracements through a dashboard and candle heatmap.
🔹 Market Structure (SMC)
The indicator automatically detects swing highs and lows to plot significant market structure levels. It identifies:
🔹 Scatter Dashboard
The dashboard, located to the right of the current price action, plots historical price swings as a scatter chart. It breaks down the market into two measurements:
🔹 Candle Heatmap
Users can color the chart candles based on the live data from the scatter plot. This allows for a direct visual correlation between the price action and the statistical intensity of current swings.
🔶 DETAILS
The scatter plot calculates the percentage change of every historical swing. By mapping these onto a quadrant system, traders can see if recent pullbacks are deep relative to their impulses.
The tool uses a simplified two-tone color scheme (Bullish vs. Bearish). These colors define the extremes of the gradient used for both the dashboard dots and the candle heatmap. Points closer to the Bullish color represent strong upward volatility, while points closer to the Bearish color represent heavy downward volatility.
🔶 SETTINGS
🔹 Core Settings
🔹 Style
🔹 Dashboard
🔶 USAGE
The script identifies key structural points and visualizes the relationship between the magnitude of price expansions and their retracements through a dashboard and candle heatmap.
🔹 Market Structure (SMC)
The indicator automatically detects swing highs and lows to plot significant market structure levels. It identifies:
- BOS (Break of Structure): Occurs when price continues in the direction of the prevailing trend by breaking a previous swing level.
- CHoCH (Change of Character): Occurs when price breaks a swing level in the opposite direction of the current trend, signaling a potential reversal.
🔹 Scatter Dashboard
The dashboard, located to the right of the current price action, plots historical price swings as a scatter chart. It breaks down the market into two measurements:
- X-Axis (Impulse): How far the market moved aggressively in the direction of the trend.
- Y-Axis (Pullback): How deep the market retraced after that initial impulse.
- Quadrant Interpretation: The top-right quadrant represents bullish sequences (upward move followed by a downward pullback), while the bottom-left represents bearish sequences (downward move followed by an upward pullback).
🔹 Candle Heatmap
Users can color the chart candles based on the live data from the scatter plot. This allows for a direct visual correlation between the price action and the statistical intensity of current swings.
🔶 DETAILS
The scatter plot calculates the percentage change of every historical swing. By mapping these onto a quadrant system, traders can see if recent pullbacks are deep relative to their impulses.
The tool uses a simplified two-tone color scheme (Bullish vs. Bearish). These colors define the extremes of the gradient used for both the dashboard dots and the candle heatmap. Points closer to the Bullish color represent strong upward volatility, while points closer to the Bearish color represent heavy downward volatility.
🔶 SETTINGS
🔹 Core Settings
- Pivot Length: Determines the sensitivity for identifying swing highs and lows.
- Color Candles via Scatter Heatmap: Toggles the candle coloring on or off.
- Heatmap Mode: Selects the logic for the candle gradient. "Pullback" (default) focuses on retracement depth, "Impulse" focuses on the strength of the trend extension, and "Combined" uses a score derived from both.
🔹 Style
- Bullish Color: Sets the color for bullish structure and the positive extreme of the heatmap gradient.
- Bearish Color: Sets the color for bearish structure and the negative extreme of the heatmap gradient.
🔹 Dashboard
- Dashboard Vertical Position: Anchors the dashboard to the Top, Middle, or Bottom of the recent price action.
- Dashboard Time Offset: Controls how many bars into the future the dashboard is projected.
- Dashboard Size Scale: Adjusts the visual size of the dashboard and its grid elements.

All content & scripts provided by LuxAlgo are for educational purposes only and are not financial advice.
Declinazione di responsabilità
Le informazioni e le pubblicazioni non sono intese come, e non costituiscono, consulenza o raccomandazioni finanziarie, di investimento, di trading o di altro tipo fornite o approvate da TradingView. Per ulteriori informazioni, consultare i Termini di utilizzo.
Declinazione di responsabilità
Le informazioni e le pubblicazioni non sono intese come, e non costituiscono, consulenza o raccomandazioni finanziarie, di investimento, di trading o di altro tipo fornite o approvate da TradingView. Per ulteriori informazioni, consultare i Termini di utilizzo.