The Oloid (OWMA) Oloid Weighted Moving Average
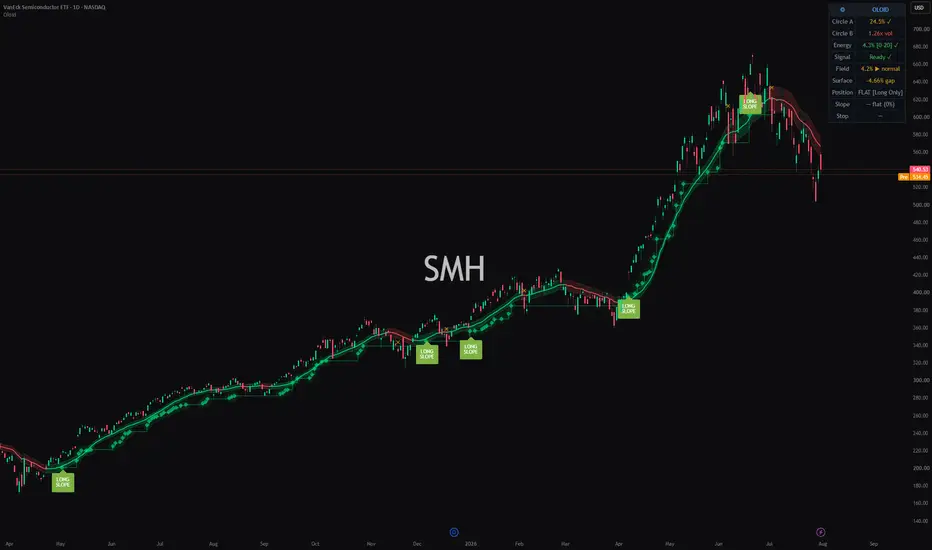
The Oloid (OWMA) — Oloid Weighted Moving Average
WHAT IT IS
The Oloid is a trend-following indicator built on the geometry of the oloid — a three-dimensional solid discovered by Paul Schatz in 1929. The oloid is the convex hull of two perpendicular circles, each passing through the center of the other. It is one of the few known solids that develops (unrolls) its entire surface onto a plane while rolling, touching every point of its surface exactly once per cycle — no point is missed, no point repeats.
This indicator translates that geometry into a novel, non-linear moving average: the Oloid Weighted Moving Average (OWMA).
MATHEMATICAL LEGACY
OWMA belongs to the lineage of geometry-inspired data analysis tools:
• Fourier Transform (1822) — decomposition of a signal into circular components.
• Wavelet Transform (1980s) — multi-scale analysis with shaped basis functions.
• OWMA (2026) — weighting of time-series data using the developable surface of a three-dimensional geometric solid.
The key innovation: using the coupling of two perpendicular circles as the weighting kernel. Fourier uses single circles. Wavelets use scaled and shifted basis functions. OWMA uses the interaction of two perpendicular oscillating systems to determine the informational value of each data point.
THE CORE IDEA
Every classic moving average weights bars by time: linearly (WMA), exponentially (EMA), or adaptively by a single volatility measure (KAMA, VIDYA). OWMA weights bars by their position on the oloid's developable surface, determined by two coupled market cycles simultaneously:
• Circle A — Momentum cycle. Each bar's local directional efficiency (a 4-bar Kaufman-style efficiency ratio) maps to an angle on the first circle.
• Circle B — Volatility cycle. Each bar's range relative to the recent average range maps to an angle on the second circle.
The oloid's center-of-mass height at the coupled position (alpha, gamma) is:
h(alpha, gamma) = h_min + dh * (0.5 + 0.5 * sin(2*alpha) * sin(2*gamma))
where h_max = sqrt(2)/2 and h_min = 3*sqrt(3)/8 are the exact geometric height extremes of a rolling oloid. The bar's weight is the INVERSE of this height:
• Bars at turning points (height minimum — the moment the rolling oloid "tips over") receive maximum weight. These are transition bars: pivots, regime changes, structure shifts.
• Bars during smooth rolling (height maximum) receive minimum weight. These are continuation bars, carrying less new information.
The result is a moving average that emphasizes market turning points and de-emphasizes continuation — behavior no linear, exponential, or single-factor adaptive MA produces, because the weight depends on the coupled state of two independent cycles, not on time or one factor alone.
HOW IT WORKS ON THE CHART
1. Oloid Line (center). The visible line does not plot OWMA directly — it tracks OWMA with adaptive speed derived from the oloid's current height. Two refinements prevent lag during strong trends:
— Velocity Lead: when adaptation is slow, the line aims where OWMA is going (target = OWMA + delta-OWMA * lead), like the contact point of an oloid rolling down a slope leading its center of mass.
— Adapt Floor: a strong trend (high efficiency ratio) guarantees a minimum tracking speed — gravity keeps the oloid rolling even at maximum height.
2. Oloid Field. ATR-based dynamic bands around the center line. The field narrows as trend efficiency rises (trending markets get a tighter channel) and widens in chop. Field color reflects price position: green above, red below, gray inside.
3. Energy metric (Data Window / dashboard). Energy = efficiency ratio * range regularity. It measures whether the oloid is "rolling" — whether the market has coherent, structured motion. Energy Up / Energy Down split it by the Oloid Line's slope direction. These values are not drawn as chart lines — they live in the dashboard and the Data Window, where the Pine Screener can also read them.
4. Slope Engine. Tracks the slope of RangeReg Bull% — the percentage of bars in the window that made new highs. The slope is classified as RISING / FLAT / FALLING. A flat-to-rising transition marks "momentum awakening": after a structural pause, bullish breadth resumes.
SIGNALS — TWO INDEPENDENT ENTRY ENGINES
• LONG-SLOPE (Pure Slope — enabled by default): RRB slope transitions flat-to-rising while close is above the Oloid Center. Catches "momentum awakening" — trend starts after a structural pause.
• LONG (OWMA Cross — off by default, optional): close crosses above the upper field boundary, with all filters passing. A dedicated filter blocks these entries while the slope is falling ("tired trend" protection). Enable this engine if you want additional breakout-style entries alongside the slope engine.
• SHORT / CLOSE: mirror logic below the field (part of the OWMA Cross engine, so they appear only when that engine is enabled); in "Long Only" mode a short signal closes the long instead. With the default configuration, positions are closed by the selected exit mode's stop.
Signal filters: an Energy window (default 0–20% — signals are suppressed when momentum is overheated), an optional minimum efficiency ratio, and a cooldown between signals.
EXIT MODES (selectable)
• Wide ATR (default, x3.5): a loose trailing stop that lets winners develop and captures more of the favorable excursion.
• ATR Trail (x2.0): classic tighter trail.
• Slope+Stop: exits when the RRB slope turns falling (momentum exhausting), with a fixed protective stop as the floor.
• Hybrid: fixed protective stop for the first N bars, then an ATR trail activates.
The current trailing stop is plotted as a step-line while a position is open.
HOW TO USE IT
1. Add to any symbol and timeframe. Defaults (Radius 21, Long Only, Pure Slope engine, Wide ATR exit) are a reasonable starting point for daily charts of trending assets.
2. Watch the dashboard (top right): Circle A (trend efficiency), Circle B (volatility state), Energy with its window check, Field width and direction, Slope state, and the active stop level.
3. Higher-quality entries tend to occur when: Energy is in the lower half of the window and rising, volatility (Circle B) is below ~110%, and the Field is narrow or narrowing (squeeze conditions).
4. Pine Screener: the "Energy Up Trend" value is exported to the Data Window — filter "Energy Up Trend between 3 and 20" to scan for symbols entering a sustained bullish momentum phase.
5. Alerts are provided for both entry engines, exits, the Bullish Trend Zone, and slope-state transitions (diagnostic).
INPUTS SUMMARY
• Oloid Geometry: Radius (base period of both circles, default 21), Circle Coupling (0.5 = the oloid's natural geometry), Meander Intensity.
• Signals: mode (Long Only / Short Only / Both), Energy window, minimum ER, cooldown.
• Slope Engine: enable/disable each engine, falling-slope filter, slope smoothing and flat threshold.
• Exit Mode: the four modes described above with their parameters.
NOTES
• The indicator is self-contained: all mathematics is computed from the oloid's parametric geometry (height function, surface development, coupling), plus standard building blocks (ATR, efficiency ratio, SMA/EMA smoothing).
• A square-root recency decay is combined with the oloid surface weight, so the total weighting respects both surface position and recency.
• Signals are generated on bar close and do not repaint: the position state machine uses confirmed values only.
• This is a technical analysis tool, not financial advice. Test on your instruments and timeframes before using signals in live trading.
WHAT IT IS
The Oloid is a trend-following indicator built on the geometry of the oloid — a three-dimensional solid discovered by Paul Schatz in 1929. The oloid is the convex hull of two perpendicular circles, each passing through the center of the other. It is one of the few known solids that develops (unrolls) its entire surface onto a plane while rolling, touching every point of its surface exactly once per cycle — no point is missed, no point repeats.
This indicator translates that geometry into a novel, non-linear moving average: the Oloid Weighted Moving Average (OWMA).
MATHEMATICAL LEGACY
OWMA belongs to the lineage of geometry-inspired data analysis tools:
• Fourier Transform (1822) — decomposition of a signal into circular components.
• Wavelet Transform (1980s) — multi-scale analysis with shaped basis functions.
• OWMA (2026) — weighting of time-series data using the developable surface of a three-dimensional geometric solid.
The key innovation: using the coupling of two perpendicular circles as the weighting kernel. Fourier uses single circles. Wavelets use scaled and shifted basis functions. OWMA uses the interaction of two perpendicular oscillating systems to determine the informational value of each data point.
THE CORE IDEA
Every classic moving average weights bars by time: linearly (WMA), exponentially (EMA), or adaptively by a single volatility measure (KAMA, VIDYA). OWMA weights bars by their position on the oloid's developable surface, determined by two coupled market cycles simultaneously:
• Circle A — Momentum cycle. Each bar's local directional efficiency (a 4-bar Kaufman-style efficiency ratio) maps to an angle on the first circle.
• Circle B — Volatility cycle. Each bar's range relative to the recent average range maps to an angle on the second circle.
The oloid's center-of-mass height at the coupled position (alpha, gamma) is:
h(alpha, gamma) = h_min + dh * (0.5 + 0.5 * sin(2*alpha) * sin(2*gamma))
where h_max = sqrt(2)/2 and h_min = 3*sqrt(3)/8 are the exact geometric height extremes of a rolling oloid. The bar's weight is the INVERSE of this height:
• Bars at turning points (height minimum — the moment the rolling oloid "tips over") receive maximum weight. These are transition bars: pivots, regime changes, structure shifts.
• Bars during smooth rolling (height maximum) receive minimum weight. These are continuation bars, carrying less new information.
The result is a moving average that emphasizes market turning points and de-emphasizes continuation — behavior no linear, exponential, or single-factor adaptive MA produces, because the weight depends on the coupled state of two independent cycles, not on time or one factor alone.
HOW IT WORKS ON THE CHART
1. Oloid Line (center). The visible line does not plot OWMA directly — it tracks OWMA with adaptive speed derived from the oloid's current height. Two refinements prevent lag during strong trends:
— Velocity Lead: when adaptation is slow, the line aims where OWMA is going (target = OWMA + delta-OWMA * lead), like the contact point of an oloid rolling down a slope leading its center of mass.
— Adapt Floor: a strong trend (high efficiency ratio) guarantees a minimum tracking speed — gravity keeps the oloid rolling even at maximum height.
2. Oloid Field. ATR-based dynamic bands around the center line. The field narrows as trend efficiency rises (trending markets get a tighter channel) and widens in chop. Field color reflects price position: green above, red below, gray inside.
3. Energy metric (Data Window / dashboard). Energy = efficiency ratio * range regularity. It measures whether the oloid is "rolling" — whether the market has coherent, structured motion. Energy Up / Energy Down split it by the Oloid Line's slope direction. These values are not drawn as chart lines — they live in the dashboard and the Data Window, where the Pine Screener can also read them.
4. Slope Engine. Tracks the slope of RangeReg Bull% — the percentage of bars in the window that made new highs. The slope is classified as RISING / FLAT / FALLING. A flat-to-rising transition marks "momentum awakening": after a structural pause, bullish breadth resumes.
SIGNALS — TWO INDEPENDENT ENTRY ENGINES
• LONG-SLOPE (Pure Slope — enabled by default): RRB slope transitions flat-to-rising while close is above the Oloid Center. Catches "momentum awakening" — trend starts after a structural pause.
• LONG (OWMA Cross — off by default, optional): close crosses above the upper field boundary, with all filters passing. A dedicated filter blocks these entries while the slope is falling ("tired trend" protection). Enable this engine if you want additional breakout-style entries alongside the slope engine.
• SHORT / CLOSE: mirror logic below the field (part of the OWMA Cross engine, so they appear only when that engine is enabled); in "Long Only" mode a short signal closes the long instead. With the default configuration, positions are closed by the selected exit mode's stop.
Signal filters: an Energy window (default 0–20% — signals are suppressed when momentum is overheated), an optional minimum efficiency ratio, and a cooldown between signals.
EXIT MODES (selectable)
• Wide ATR (default, x3.5): a loose trailing stop that lets winners develop and captures more of the favorable excursion.
• ATR Trail (x2.0): classic tighter trail.
• Slope+Stop: exits when the RRB slope turns falling (momentum exhausting), with a fixed protective stop as the floor.
• Hybrid: fixed protective stop for the first N bars, then an ATR trail activates.
The current trailing stop is plotted as a step-line while a position is open.
HOW TO USE IT
1. Add to any symbol and timeframe. Defaults (Radius 21, Long Only, Pure Slope engine, Wide ATR exit) are a reasonable starting point for daily charts of trending assets.
2. Watch the dashboard (top right): Circle A (trend efficiency), Circle B (volatility state), Energy with its window check, Field width and direction, Slope state, and the active stop level.
3. Higher-quality entries tend to occur when: Energy is in the lower half of the window and rising, volatility (Circle B) is below ~110%, and the Field is narrow or narrowing (squeeze conditions).
4. Pine Screener: the "Energy Up Trend" value is exported to the Data Window — filter "Energy Up Trend between 3 and 20" to scan for symbols entering a sustained bullish momentum phase.
5. Alerts are provided for both entry engines, exits, the Bullish Trend Zone, and slope-state transitions (diagnostic).
INPUTS SUMMARY
• Oloid Geometry: Radius (base period of both circles, default 21), Circle Coupling (0.5 = the oloid's natural geometry), Meander Intensity.
• Signals: mode (Long Only / Short Only / Both), Energy window, minimum ER, cooldown.
• Slope Engine: enable/disable each engine, falling-slope filter, slope smoothing and flat threshold.
• Exit Mode: the four modes described above with their parameters.
NOTES
• The indicator is self-contained: all mathematics is computed from the oloid's parametric geometry (height function, surface development, coupling), plus standard building blocks (ATR, efficiency ratio, SMA/EMA smoothing).
• A square-root recency decay is combined with the oloid surface weight, so the total weighting respects both surface position and recency.
• Signals are generated on bar close and do not repaint: the position state machine uses confirmed values only.
• This is a technical analysis tool, not financial advice. Test on your instruments and timeframes before using signals in live trading.

Declinazione di responsabilità
Le informazioni e le pubblicazioni non sono intese come, e non costituiscono, consulenza o raccomandazioni finanziarie, di investimento, di trading o di altro tipo fornite o approvate da TradingView. Per ulteriori informazioni, consultare i Termini di utilizzo.
Declinazione di responsabilità
Le informazioni e le pubblicazioni non sono intese come, e non costituiscono, consulenza o raccomandazioni finanziarie, di investimento, di trading o di altro tipo fornite o approvate da TradingView. Per ulteriori informazioni, consultare i Termini di utilizzo.