OPEN-SOURCE SCRIPT
Aggiornato Effective Spread Oscillator
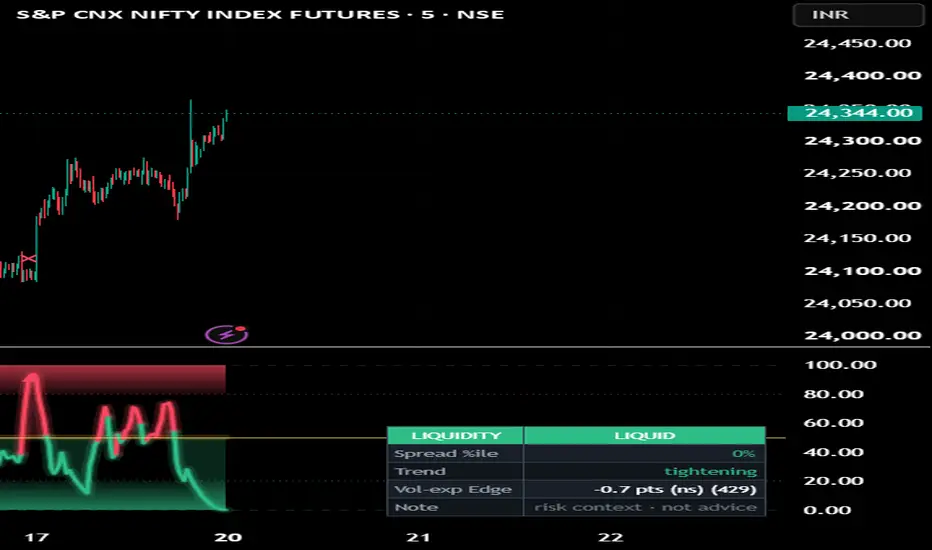
Overview
Effective Spread Oscillator is a liquidity gauge built from price alone. It estimates the effective bid-ask spread — the real round-trip cost of trading — from open/high/low/close bars, with no quote or order-book data, then percentile-ranks it into a 0–100 read. High = a wide effective spread: thin, illiquid, stressed conditions where slippage and gaps are large. Low = a tight spread: deep, liquid, orderly trade. It is an analytical study of market liquidity and trading friction — not a directional signal and not a strategy.
Why these parts are ONE tool (mashup justification)
Liquidity is normally invisible without Level-2 data. This reconstructs it from bars and then makes it usable, in a chain where each link fixes what the previous one can't do alone:
A low-frequency spread estimator recovers the effective spread from the geometry of OHLC prices — the cost the tape hides. Two are offered: Abdi-Ranaldo (close vs the high-low mid-range) and Corwin-Schultz (consecutive high-low ranges). Negative small-sample estimates — a known statistical artefact of these methods — are floored at zero.
Percentile ranking turns an instrument-specific cost into a universal 0–100 read, so "expensive liquidity" means the same thing on an index future, a stock, or FX. A raw spread number in basis points is not comparable across symbols; a percentile is.
A liquidity-state verdict (stressed / normal / liquid) plus a widening-vs-tightening read makes it legible at a glance, which a bare number isn't.
The calibration harness then tests the well-documented link on your instrument: does a spread spike actually precede a volatility expansion? It reports the conditional hit rate against the unconditional base rate, so you see the Edge rather than assume it.
Chained, they answer one question: is liquidity stressed right now, and has that stress preceded bigger moves here?
How it works
The estimator is computed on log prices and evaluated one bar back (so no future value is referenced), averaged over a window, optionally smoothed, and percentile-ranked over a lookback into the 0–100 oscillator. A spike arms when the spread crosses into the high band; the harness then checks whether the realised range over the next horizon exceeds k × ATR × √horizon more often than the base rate. (The √horizon term keeps the base rate informative near 50% instead of saturating on intraday charts.)
How to use it
The high band (above the upper guide) is stressed / illiquid: widen stops, expect slippage and gaps, and treat breakouts with care — this is where volatility expansions cluster. The low band is liquid / orderly: tighter behaviour, cleaner fills. Use it as a risk and position-sizing context that sits behind your directional tools, and read the Edge row to see whether spread spikes have actually preceded bigger ranges on this symbol. Spikes are marked in the pane and, optionally, on the price chart. The dashboard has a Compact layout (default) and a Pro layout (estimator in use, spread in bps, spike sample, base rate). Context — never a standalone trigger.
Universal across markets
The high / low / close inputs are configurable, so it runs on any instrument and timeframe. Defaults target intraday index futures. Crucially, it needs no volume, so it also works on volume-less feeds (cash indices, spot FX) where flow-based tools cannot.
Non-repainting
The estimator is evaluated one bar back, so it never references a future value, and the calibration harness logs and resolves only on confirmed bars, so its statistics never inflate intrabar. The live oscillator value updates each bar, like any oscillator.
Originality
The spread estimators are published academic work, credited below. What's original here is the construction around them: the percentile normalisation that makes the cost comparable across instruments, the liquidity-state and widening/tightening read, the price-overlay stress marker, and — most of all — the forward-calibration harness that tests the spread-spike → volatility-expansion link against a base rate on your own symbol rather than asserting it. Clean-room implementation; no third-party code reused.
Concept credits
Serial-covariance spread estimator — Richard Roll (1984)
High-low range spread — Shane Corwin & Paul Schultz (2012)
Close-high-low spread — Farshid Abdi & Angelo Ranaldo (2017)
The current state of the art generalising this family to the full OHLC information set is the EDGE estimator of David Ardia, Emanuele Guidotti & Tim Kroencke (Journal of Financial Economics, 2024). This script implements the Corwin-Schultz and Abdi-Ranaldo estimators.
Honest limits
These are estimates of the effective spread from bar geometry, not measured quotes — accurate in aggregate, noisy bar to bar, which is exactly why a window and smoothing are used. Estimates can be small and are floored at zero in tiny samples. The Edge figures are in-sample, with overlapping forward windows and no costs — descriptive context, not a verified backtest. Nothing here predicts direction.
Disclaimer
Research and educational tool only. Not financial advice and no guarantee of profitability or accuracy. Indicators describe past behaviour; they do not predict the future. Trading carries risk of loss. Test out-of-sample and make your own decisions. The author accepts no liability.
Effective Spread Oscillator is a liquidity gauge built from price alone. It estimates the effective bid-ask spread — the real round-trip cost of trading — from open/high/low/close bars, with no quote or order-book data, then percentile-ranks it into a 0–100 read. High = a wide effective spread: thin, illiquid, stressed conditions where slippage and gaps are large. Low = a tight spread: deep, liquid, orderly trade. It is an analytical study of market liquidity and trading friction — not a directional signal and not a strategy.
Why these parts are ONE tool (mashup justification)
Liquidity is normally invisible without Level-2 data. This reconstructs it from bars and then makes it usable, in a chain where each link fixes what the previous one can't do alone:
A low-frequency spread estimator recovers the effective spread from the geometry of OHLC prices — the cost the tape hides. Two are offered: Abdi-Ranaldo (close vs the high-low mid-range) and Corwin-Schultz (consecutive high-low ranges). Negative small-sample estimates — a known statistical artefact of these methods — are floored at zero.
Percentile ranking turns an instrument-specific cost into a universal 0–100 read, so "expensive liquidity" means the same thing on an index future, a stock, or FX. A raw spread number in basis points is not comparable across symbols; a percentile is.
A liquidity-state verdict (stressed / normal / liquid) plus a widening-vs-tightening read makes it legible at a glance, which a bare number isn't.
The calibration harness then tests the well-documented link on your instrument: does a spread spike actually precede a volatility expansion? It reports the conditional hit rate against the unconditional base rate, so you see the Edge rather than assume it.
Chained, they answer one question: is liquidity stressed right now, and has that stress preceded bigger moves here?
How it works
The estimator is computed on log prices and evaluated one bar back (so no future value is referenced), averaged over a window, optionally smoothed, and percentile-ranked over a lookback into the 0–100 oscillator. A spike arms when the spread crosses into the high band; the harness then checks whether the realised range over the next horizon exceeds k × ATR × √horizon more often than the base rate. (The √horizon term keeps the base rate informative near 50% instead of saturating on intraday charts.)
How to use it
The high band (above the upper guide) is stressed / illiquid: widen stops, expect slippage and gaps, and treat breakouts with care — this is where volatility expansions cluster. The low band is liquid / orderly: tighter behaviour, cleaner fills. Use it as a risk and position-sizing context that sits behind your directional tools, and read the Edge row to see whether spread spikes have actually preceded bigger ranges on this symbol. Spikes are marked in the pane and, optionally, on the price chart. The dashboard has a Compact layout (default) and a Pro layout (estimator in use, spread in bps, spike sample, base rate). Context — never a standalone trigger.
Universal across markets
The high / low / close inputs are configurable, so it runs on any instrument and timeframe. Defaults target intraday index futures. Crucially, it needs no volume, so it also works on volume-less feeds (cash indices, spot FX) where flow-based tools cannot.
Non-repainting
The estimator is evaluated one bar back, so it never references a future value, and the calibration harness logs and resolves only on confirmed bars, so its statistics never inflate intrabar. The live oscillator value updates each bar, like any oscillator.
Originality
The spread estimators are published academic work, credited below. What's original here is the construction around them: the percentile normalisation that makes the cost comparable across instruments, the liquidity-state and widening/tightening read, the price-overlay stress marker, and — most of all — the forward-calibration harness that tests the spread-spike → volatility-expansion link against a base rate on your own symbol rather than asserting it. Clean-room implementation; no third-party code reused.
Concept credits
Serial-covariance spread estimator — Richard Roll (1984)
High-low range spread — Shane Corwin & Paul Schultz (2012)
Close-high-low spread — Farshid Abdi & Angelo Ranaldo (2017)
The current state of the art generalising this family to the full OHLC information set is the EDGE estimator of David Ardia, Emanuele Guidotti & Tim Kroencke (Journal of Financial Economics, 2024). This script implements the Corwin-Schultz and Abdi-Ranaldo estimators.
Honest limits
These are estimates of the effective spread from bar geometry, not measured quotes — accurate in aggregate, noisy bar to bar, which is exactly why a window and smoothing are used. Estimates can be small and are floored at zero in tiny samples. The Edge figures are in-sample, with overlapping forward windows and no costs — descriptive context, not a verified backtest. Nothing here predicts direction.
Disclaimer
Research and educational tool only. Not financial advice and no guarantee of profitability or accuracy. Indicators describe past behaviour; they do not predict the future. Trading carries risk of loss. Test out-of-sample and make your own decisions. The author accepts no liability.
Note di rilascio
v1.1 — Confidence interval on the edge (no engine change)- Added a Wilson 95% confidence interval and a significance test to the calibration: the
spike→volatility-expansion Edge now reads "✓sig" only when the interval's lower bound clears the
base rate (with a minimum spike count), so a small edge on a thin sample is no longer mistaken for
a real one. The panel shows the significance verdict and a new "Hit 95% CI" row; the lower-bound
edge is exported as EXP_EdgeLB (> 0 = significant).
- No change to the spread estimators, the percentile oscillator, the liquidity state or the spike
logging — everyday behaviour is identical.
Descriptive liquidity / risk-context tool, in-sample statistics, not investment advice.
Script open-source
Nello spirito di TradingView, l'autore di questo script lo ha reso open source, in modo che i trader possano esaminarne e verificarne la funzionalità. Complimenti all'autore! Sebbene sia possibile utilizzarlo gratuitamente, ricordiamo che la ripubblicazione del codice è soggetta al nostro Regolamento.

Declinazione di responsabilità
Le informazioni e le pubblicazioni non sono intese come, e non costituiscono, consulenza o raccomandazioni finanziarie, di investimento, di trading o di altro tipo fornite o approvate da TradingView. Per ulteriori informazioni, consultare i Termini di utilizzo.
Script open-source
Nello spirito di TradingView, l'autore di questo script lo ha reso open source, in modo che i trader possano esaminarne e verificarne la funzionalità. Complimenti all'autore! Sebbene sia possibile utilizzarlo gratuitamente, ricordiamo che la ripubblicazione del codice è soggetta al nostro Regolamento.
Declinazione di responsabilità
Le informazioni e le pubblicazioni non sono intese come, e non costituiscono, consulenza o raccomandazioni finanziarie, di investimento, di trading o di altro tipo fornite o approvate da TradingView. Per ulteriori informazioni, consultare i Termini di utilizzo.