[CT] Advanced CVD Histogram with Entry Signals
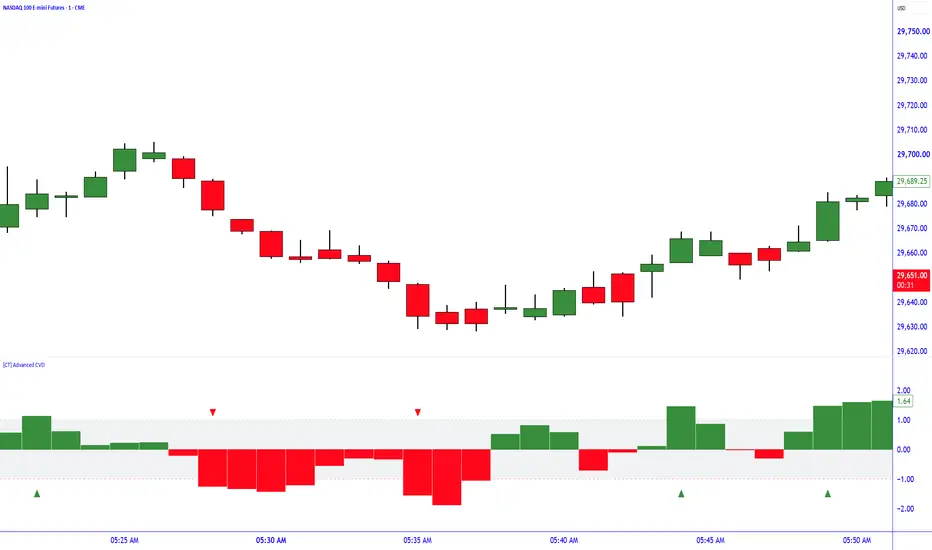
[CT] Advanced CVD Histogram with Entry Signals
OVERVIEW
The [CT] Advanced CVD Histogram with Entry Signals is a volume-momentum oscillator designed to help traders identify changes in estimated buying and selling pressure, recognize shifts in cumulative volume momentum, and evaluate potential bullish and bearish trading opportunities.
Unlike traditional Cumulative Volume Delta indicators that primarily display accumulated volume, this indicator focuses on the momentum of smoothed CVD and normalizes that momentum relative to its recent standard deviation.
This creates a responsive histogram that provides insight into the strength, direction, and changes of estimated volume momentum.
The indicator also includes customizable entry signals, optional RSI filtering, price-chart entry markers, candle coloring that matches the histogram, and alert conditions.
KEY FEATURES
━━━━━━━━━━━━━━━━━━━━━━━━━━
1. HOW THE INDICATOR WORKS
━━━━━━━━━━━━━━━━━━━━━━━━━━
The indicator uses five calculation stages to measure estimated volume momentum.
STEP 1 — ESTIMATED VOLUME DELTA
Each candle's volume is classified according to its price direction.
This produces an estimated volume delta for each candle.
This is a candle-direction-based volume estimate, not true bid/ask order-flow delta. It does not distinguish actual aggressive buying from aggressive selling.
STEP 2 — CUMULATIVE VOLUME DELTA
The estimated positive and negative volume values are accumulated into a running CVD calculation.
This helps measure changes in the balance of upward-classified and downward-classified volume over the available chart history.
The calculation does not automatically reset at the beginning of each trading session.
STEP 3 — CVD SMOOTHING
A Simple Moving Average is applied to cumulative delta.
Default smoothing period: 3.
This helps reduce short-term fluctuations and provides a smoother measurement of cumulative volume behavior.
STEP 4 — CVD MOMENTUM
The indicator measures the change in smoothed cumulative delta from the previous candle.
STEP 5 — MOMENTUM NORMALIZATION
CVD momentum is divided by its standard deviation over a configurable lookback period.
Default lookback period: 20.
This allows the indicator to express momentum strength relative to recent variability.
For example, a positive reading of +1.5 represents momentum equal to 1.5 times the standard deviation used in the calculation.
The normalization is not a conventional z-score because the mean is not subtracted before dividing by standard deviation.
━━━━━━━━━━━━━━━━━━━━━━━━━━
2. UNDERSTANDING THE HISTOGRAM
━━━━━━━━━━━━━━━━━━━━━━━━━━
The histogram appears in a dedicated lower indicator panel and provides a visual representation of normalized CVD momentum.
GREEN HISTOGRAM — POSITIVE MOMENTUM
Green histogram bars represent positive normalized CVD momentum.
RED HISTOGRAM — NEGATIVE MOMENTUM
Red histogram bars represent zero or negative normalized CVD momentum.
THE ZERO LINE
The zero line separates bullish and bearish momentum classifications.
Important: A green histogram does not guarantee price will rise, and a red histogram does not guarantee price will decline.
━━━━━━━━━━━━━━━━━━━━━━━━━━
3. SIGNAL THRESHOLDS
━━━━━━━━━━━━━━━━━━━━━━━━━━
The indicator uses two symmetrical momentum thresholds to identify unusually strong readings.
Default Thresholds:
When normalized momentum exceeds +1.0, the positive momentum condition becomes eligible for a bullish entry signal.
When normalized momentum falls below -1.0, the negative momentum condition becomes eligible for a bearish entry signal.
Adjustable Sensitivity
Traders can adjust this setting according to their preferred market, timeframe, and trading methodology.
━━━━━━━━━━━━━━━━━━━━━━━━━━
4. BUY AND SELL ENTRY SIGNALS
━━━━━━━━━━━━━━━━━━━━━━━━━━
The indicator generates potential entry markers when normalized CVD momentum exceeds the configured threshold and any enabled filters are satisfied.
GREEN TRIANGLE — BUY SIGNAL
A bullish signal qualifies when:
Default BUY Condition:
Normalized CVD momentum greater than +1.0.
A green triangle is displayed below the corresponding price candle when price-chart signals are enabled.
RED TRIANGLE — SELL SIGNAL
A bearish signal qualifies when:
Default SELL Condition:
Normalized CVD momentum less than -1.0.
A red triangle is displayed above the corresponding price candle when price-chart signals are enabled.
SIGNAL LOCATION CONTROLS
Traders can choose where their entry markers appear.
Both signal displays use the same calculation and entry conditions.
Entry markers indicate qualifying momentum conditions. They do not represent executed orders or guaranteed trade opportunities.
━━━━━━━━━━━━━━━━━━━━━━━━━━
5. ENTRY SIGNAL MODES
━━━━━━━━━━━━━━━━━━━━━━━━━━
The indicator offers two ways to display entry signals.
FIRST THRESHOLD CROSS — DEFAULT
A marker appears when the complete qualifying condition changes from false to true.
Example:
When the RSI filter is enabled, a new entry can also qualify because the RSI requirement becomes satisfied, even if momentum was already beyond its threshold.
This mode helps reduce repetitive signals and highlight the beginning of qualifying momentum conditions.
EVERY QUALIFYING BAR
A new entry marker appears on each candle satisfying the complete signal conditions.
This mode allows traders to continuously identify periods of strong positive or negative momentum.
━━━━━━━━━━━━━━━━━━━━━━━━━━
6. OPTIONAL RSI FILTER
━━━━━━━━━━━━━━━━━━━━━━━━━━
The Relative Strength Index filter provides an additional condition for qualifying potential entries.
Default RSI Settings:
WITH RSI FILTER DISABLED
The indicator focuses exclusively on normalized CVD momentum for entry qualification.
This configuration is primarily oriented toward directional volume-momentum signals.
WITH RSI FILTER ENABLED
Entry conditions must satisfy both CVD momentum and RSI requirements.
This configuration focuses on identifying potential reversals during RSI extremes.
The filter may significantly reduce signal frequency.
━━━━━━━━━━━━━━━━━━━━━━━━━━
7. OPTIONAL PRICE CANDLE COLORING
━━━━━━━━━━━━━━━━━━━━━━━━━━
The indicator includes an optional candle-coloring feature that allows the main price candles to reflect the same momentum direction as the histogram.
CANDLE COLOR RULES
The candle colors are independent of entry signals.
For example, a price candle may appear green because CVD momentum is positive, even when momentum has not reached the BUY signal threshold.
CONFIRMED CANDLE COLORING
Traders can enable the Confirmed Candles Only option.
When enabled, historical candles use completed momentum readings, while the current developing candle is not recolored until it closes.
Default Settings:
This option provides additional visual confirmation without requiring traders to continually reference the histogram panel.
━━━━━━━━━━━━━━━━━━━━━━━━━━
8. CANDLE-CLOSE SIGNAL CONFIRMATION
━━━━━━━━━━━━━━━━━━━━━━━━━━
Entry signals are configured to require candle-close confirmation by default.
When enabled:
Candle-close confirmation is optional for traders who prefer to observe developing signals before the bar closes.
The histogram updates with current-bar data. Candle-close confirmation applies to the entry signals and, separately, to candle coloring when that option is selected.
━━━━━━━━━━━━━━━━━━━━━━━━━━
9. TRADING APPLICATIONS
━━━━━━━━━━━━━━━━━━━━━━━━━━
APPLICATION 1 — BULLISH MOMENTUM CONFIRMATION
APPLICATION 2 — BEARISH MOMENTUM CONFIRMATION
APPLICATION 3 — POTENTIAL REVERSAL CONDITIONS
Enable the optional RSI filter to identify strong CVD momentum during overbought or oversold conditions.
APPLICATION 4 — MOMENTUM WEAKNESS
The histogram can also be used without relying on entry markers.
These conditions can help traders evaluate whether momentum continues to support an existing trading position.
━━━━━━━━━━━━━━━━━━━━━━━━━━
10. INDICATOR SETTINGS
━━━━━━━━━━━━━━━━━━━━━━━━━━
CVD CALCULATIONS
RSI SETTINGS
HISTOGRAM APPEARANCE
ENTRY SIGNAL CONTROLS
PRICE CANDLE COLORING
━━━━━━━━━━━━━━━━━━━━━━━━━━
11. TRADINGVIEW ALERTS
━━━━━━━━━━━━━━━━━━━━━━━━━━
The indicator includes three configurable alert conditions.
Alerts follow the selected entry mode and confirmation settings.
For confirmed signals, enable candle-close confirmation and select Once Per Bar Close in the TradingView alert configuration.
━━━━━━━━━━━━━━━━━━━━━━━━━━
12. IMPORTANT INFORMATION AND LIMITATIONS
━━━━━━━━━━━━━━━━━━━━━━━━━━
The indicator is intended to support technical analysis rather than replace price-action confirmation or risk management.
━━━━━━━━━━━━━━━━━━━━━━━━━━
CONCLUSION
━━━━━━━━━━━━━━━━━━━━━━━━━━
The [CT] Advanced CVD Histogram with Entry Signals combines estimated cumulative volume delta, normalized momentum analysis, configurable BUY and SELL conditions, and optional chart visualization features into one trading tool.
By displaying momentum strength through a color-coded histogram, marking qualifying entry conditions directly on price candles, and optionally coloring those candles to match the histogram, the indicator provides a visual method for evaluating bullish and bearish momentum.
Whether analyzing trend continuation, potential reversals, or changes in volume momentum, the indicator is designed to complement a structured approach to trading.
Follow the structure. Evaluate the momentum. Confirm the entry. Manage the risk.
DISCLAIMER
This indicator is provided for educational and technical-analysis purposes only. It is not financial advice and does not guarantee profitable trading results. All trading involves risk, including the possibility of substantial financial loss.
OVERVIEW
The [CT] Advanced CVD Histogram with Entry Signals is a volume-momentum oscillator designed to help traders identify changes in estimated buying and selling pressure, recognize shifts in cumulative volume momentum, and evaluate potential bullish and bearish trading opportunities.
Unlike traditional Cumulative Volume Delta indicators that primarily display accumulated volume, this indicator focuses on the momentum of smoothed CVD and normalizes that momentum relative to its recent standard deviation.
This creates a responsive histogram that provides insight into the strength, direction, and changes of estimated volume momentum.
The indicator also includes customizable entry signals, optional RSI filtering, price-chart entry markers, candle coloring that matches the histogram, and alert conditions.
KEY FEATURES
- Normalized CVD Momentum Histogram: Displays positive and negative changes in smoothed cumulative volume delta.
- Automatic BUY and SELL Signals: Identifies candles where volume momentum exceeds adjustable positive or negative thresholds.
- Main Price-Chart Entry Markers: Displays bullish triangles below price candles and bearish triangles above price candles.
- Optional Histogram-Panel Signals: Allows entry markers to appear directly within the oscillator panel.
- Customizable Candle Coloring: Colors price candles to match the histogram's bullish and bearish momentum.
- Optional RSI Filter: Adds overbought and oversold conditions to entry-signal qualification.
- Adjustable Signal Thresholds: Allows traders to control the required normalized momentum magnitude.
- Two Entry-Signal Modes: Choose between the first qualifying condition or every qualifying candle.
- Confirmed Entry Signals: Optional candle-close confirmation helps reduce temporary intrabar signals.
- TradingView Alerts: Includes bullish, bearish, and combined entry alert conditions.
━━━━━━━━━━━━━━━━━━━━━━━━━━
1. HOW THE INDICATOR WORKS
━━━━━━━━━━━━━━━━━━━━━━━━━━
The indicator uses five calculation stages to measure estimated volume momentum.
STEP 1 — ESTIMATED VOLUME DELTA
Each candle's volume is classified according to its price direction.
- Bullish candle (close above open): Volume is classified as positive.
- Bearish or doji candle (close at or below open): Volume is classified as negative.
This produces an estimated volume delta for each candle.
This is a candle-direction-based volume estimate, not true bid/ask order-flow delta. It does not distinguish actual aggressive buying from aggressive selling.
STEP 2 — CUMULATIVE VOLUME DELTA
The estimated positive and negative volume values are accumulated into a running CVD calculation.
This helps measure changes in the balance of upward-classified and downward-classified volume over the available chart history.
The calculation does not automatically reset at the beginning of each trading session.
STEP 3 — CVD SMOOTHING
A Simple Moving Average is applied to cumulative delta.
Default smoothing period: 3.
This helps reduce short-term fluctuations and provides a smoother measurement of cumulative volume behavior.
STEP 4 — CVD MOMENTUM
The indicator measures the change in smoothed cumulative delta from the previous candle.
- Positive momentum indicates that smoothed cumulative delta is rising.
- Negative momentum indicates that smoothed cumulative delta is falling.
- Momentum approaching zero indicates a reduction in the magnitude of the rate of change.
STEP 5 — MOMENTUM NORMALIZATION
CVD momentum is divided by its standard deviation over a configurable lookback period.
Default lookback period: 20.
This allows the indicator to express momentum strength relative to recent variability.
For example, a positive reading of +1.5 represents momentum equal to 1.5 times the standard deviation used in the calculation.
The normalization is not a conventional z-score because the mean is not subtracted before dividing by standard deviation.
━━━━━━━━━━━━━━━━━━━━━━━━━━
2. UNDERSTANDING THE HISTOGRAM
━━━━━━━━━━━━━━━━━━━━━━━━━━
The histogram appears in a dedicated lower indicator panel and provides a visual representation of normalized CVD momentum.
GREEN HISTOGRAM — POSITIVE MOMENTUM
Green histogram bars represent positive normalized CVD momentum.
- Green bars extending higher indicate strengthening positive momentum.
- Green bars decreasing toward zero indicate weakening positive momentum.
- A change from red to green indicates a transition from negative to positive momentum.
RED HISTOGRAM — NEGATIVE MOMENTUM
Red histogram bars represent zero or negative normalized CVD momentum.
- Red bars extending farther below zero indicate strengthening negative momentum.
- Red bars moving back toward zero indicate weakening negative momentum.
- A transition from green to red indicates a change from positive to nonpositive momentum.
THE ZERO LINE
The zero line separates bullish and bearish momentum classifications.
- Above zero: Positive CVD momentum.
- Below zero: Negative CVD momentum.
- Crossing zero: A change in the direction of smoothed CVD momentum.
Important: A green histogram does not guarantee price will rise, and a red histogram does not guarantee price will decline.
━━━━━━━━━━━━━━━━━━━━━━━━━━
3. SIGNAL THRESHOLDS
━━━━━━━━━━━━━━━━━━━━━━━━━━
The indicator uses two symmetrical momentum thresholds to identify unusually strong readings.
Default Thresholds:
- Upper Threshold: +1.0
- Lower Threshold: -1.0
When normalized momentum exceeds +1.0, the positive momentum condition becomes eligible for a bullish entry signal.
When normalized momentum falls below -1.0, the negative momentum condition becomes eligible for a bearish entry signal.
Adjustable Sensitivity
- Lower thresholds allow more momentum readings to qualify.
- Higher thresholds require stronger momentum readings and generally reduce signal frequency.
- The threshold controls signal sensitivity, not the probability of a profitable trade.
Traders can adjust this setting according to their preferred market, timeframe, and trading methodology.
━━━━━━━━━━━━━━━━━━━━━━━━━━
4. BUY AND SELL ENTRY SIGNALS
━━━━━━━━━━━━━━━━━━━━━━━━━━
The indicator generates potential entry markers when normalized CVD momentum exceeds the configured threshold and any enabled filters are satisfied.
GREEN TRIANGLE — BUY SIGNAL
A bullish signal qualifies when:
- Normalized CVD momentum exceeds the positive threshold.
- If enabled, the RSI filter confirms the oversold requirement.
- The selected signal mode allows a marker.
- Candle-close confirmation is satisfied when enabled.
Default BUY Condition:
Normalized CVD momentum greater than +1.0.
A green triangle is displayed below the corresponding price candle when price-chart signals are enabled.
RED TRIANGLE — SELL SIGNAL
A bearish signal qualifies when:
- Normalized CVD momentum falls below the negative threshold.
- If enabled, the RSI filter confirms the overbought requirement.
- The selected signal mode allows a marker.
- Candle-close confirmation is satisfied when enabled.
Default SELL Condition:
Normalized CVD momentum less than -1.0.
A red triangle is displayed above the corresponding price candle when price-chart signals are enabled.
SIGNAL LOCATION CONTROLS
Traders can choose where their entry markers appear.
- Main Price Chart: Enabled by default.
- Histogram Panel: Disabled by default.
Both signal displays use the same calculation and entry conditions.
Entry markers indicate qualifying momentum conditions. They do not represent executed orders or guaranteed trade opportunities.
━━━━━━━━━━━━━━━━━━━━━━━━━━
5. ENTRY SIGNAL MODES
━━━━━━━━━━━━━━━━━━━━━━━━━━
The indicator offers two ways to display entry signals.
FIRST THRESHOLD CROSS — DEFAULT
A marker appears when the complete qualifying condition changes from false to true.
Example:
- Normalized CVD momentum is below the positive threshold.
- Momentum rises above the positive threshold.
- A bullish entry marker appears when the condition first qualifies.
- Additional markers are suppressed while that condition remains continuously true.
When the RSI filter is enabled, a new entry can also qualify because the RSI requirement becomes satisfied, even if momentum was already beyond its threshold.
This mode helps reduce repetitive signals and highlight the beginning of qualifying momentum conditions.
EVERY QUALIFYING BAR
A new entry marker appears on each candle satisfying the complete signal conditions.
This mode allows traders to continuously identify periods of strong positive or negative momentum.
━━━━━━━━━━━━━━━━━━━━━━━━━━
6. OPTIONAL RSI FILTER
━━━━━━━━━━━━━━━━━━━━━━━━━━
The Relative Strength Index filter provides an additional condition for qualifying potential entries.
Default RSI Settings:
- Use RSI Filter: OFF
- RSI Period: 14
- RSI Oversold: 30
- RSI Overbought: 70
WITH RSI FILTER DISABLED
The indicator focuses exclusively on normalized CVD momentum for entry qualification.
- Positive momentum above the threshold can produce a BUY signal.
- Negative momentum below the threshold can produce a SELL signal.
This configuration is primarily oriented toward directional volume-momentum signals.
WITH RSI FILTER ENABLED
Entry conditions must satisfy both CVD momentum and RSI requirements.
- BUY: Positive CVD momentum exceeds the threshold while RSI is below its oversold level.
- SELL: Negative CVD momentum exceeds the bearish threshold while RSI is above its overbought level.
This configuration focuses on identifying potential reversals during RSI extremes.
The filter may significantly reduce signal frequency.
━━━━━━━━━━━━━━━━━━━━━━━━━━
7. OPTIONAL PRICE CANDLE COLORING
━━━━━━━━━━━━━━━━━━━━━━━━━━
The indicator includes an optional candle-coloring feature that allows the main price candles to reflect the same momentum direction as the histogram.
CANDLE COLOR RULES
- Bullish Color: Price candles display the selected bullish histogram color when normalized CVD momentum is above zero.
- Bearish Color: Price candles display the selected bearish histogram color when normalized CVD momentum is zero or below.
The candle colors are independent of entry signals.
For example, a price candle may appear green because CVD momentum is positive, even when momentum has not reached the BUY signal threshold.
CONFIRMED CANDLE COLORING
Traders can enable the Confirmed Candles Only option.
When enabled, historical candles use completed momentum readings, while the current developing candle is not recolored until it closes.
Default Settings:
- Price Candle Coloring: OFF
- Confirmed Candle Colors Only: ON
This option provides additional visual confirmation without requiring traders to continually reference the histogram panel.
━━━━━━━━━━━━━━━━━━━━━━━━━━
8. CANDLE-CLOSE SIGNAL CONFIRMATION
━━━━━━━━━━━━━━━━━━━━━━━━━━
Entry signals are configured to require candle-close confirmation by default.
When enabled:
- The indicator waits until the candle has completed.
- The qualifying momentum and filter conditions are evaluated at candle close.
- Confirmed signals remain tied to completed candles.
- Temporary intrabar conditions do not create confirmed entry markers.
Candle-close confirmation is optional for traders who prefer to observe developing signals before the bar closes.
The histogram updates with current-bar data. Candle-close confirmation applies to the entry signals and, separately, to candle coloring when that option is selected.
━━━━━━━━━━━━━━━━━━━━━━━━━━
9. TRADING APPLICATIONS
━━━━━━━━━━━━━━━━━━━━━━━━━━
APPLICATION 1 — BULLISH MOMENTUM CONFIRMATION
- Identify bullish market structure or a potential continuation opportunity.
- Observe the histogram moving above zero.
- Look for normalized momentum to exceed the positive threshold.
- Wait for a qualifying green entry marker.
- Evaluate price-action confirmation before considering a long position.
- Define risk using an appropriate invalidation level.
APPLICATION 2 — BEARISH MOMENTUM CONFIRMATION
- Identify bearish market structure or a potential bearish continuation setup.
- Observe the histogram moving below zero.
- Look for momentum to exceed the negative threshold in magnitude.
- Wait for a qualifying red entry marker.
- Confirm the setup through price action and market structure.
- Establish a predefined risk-management plan.
APPLICATION 3 — POTENTIAL REVERSAL CONDITIONS
Enable the optional RSI filter to identify strong CVD momentum during overbought or oversold conditions.
- Identify an extended price movement.
- Locate a significant support or resistance area.
- Watch for positive momentum during oversold RSI or negative momentum during overbought RSI.
- Observe whether a qualifying entry marker appears.
- Wait for supporting price-action evidence before considering a reversal trade.
APPLICATION 4 — MOMENTUM WEAKNESS
The histogram can also be used without relying on entry markers.
- Positive bars shrinking toward zero may indicate weakening positive CVD momentum.
- Negative bars moving toward zero may indicate weakening negative CVD momentum.
- Zero-line transitions identify changes in smoothed CVD momentum direction.
These conditions can help traders evaluate whether momentum continues to support an existing trading position.
━━━━━━━━━━━━━━━━━━━━━━━━━━
10. INDICATOR SETTINGS
━━━━━━━━━━━━━━━━━━━━━━━━━━
CVD CALCULATIONS
- Lookback Period: 20
- Smoothing Period: 3
- Signal Threshold: 1.0
RSI SETTINGS
- Use RSI Filter: OFF
- RSI Period: 14
- RSI Oversold: 30
- RSI Overbought: 70
HISTOGRAM APPEARANCE
- Bullish Histogram Color: Customizable
- Bearish Histogram Color: Customizable
- Zero Line: Displayed
- Positive Threshold: Displayed
- Negative Threshold: Displayed
ENTRY SIGNAL CONTROLS
- Show Entry Signals: ON
- Show Signals on Price Chart: ON
- Show Signals in Histogram Panel: OFF
- Confirm Signals on Candle Close: ON
- Entry Signal Mode: First Threshold Cross
- BUY Marker Color: Customizable
- SELL Marker Color: Customizable
PRICE CANDLE COLORING
- Color Price Candles: OFF
- Color Confirmed Candles Only: ON
━━━━━━━━━━━━━━━━━━━━━━━━━━
11. TRADINGVIEW ALERTS
━━━━━━━━━━━━━━━━━━━━━━━━━━
The indicator includes three configurable alert conditions.
- Advanced CVD BUY Entry: Identifies a qualifying bullish entry condition.
- Advanced CVD SELL Entry: Identifies a qualifying bearish entry condition.
- Advanced CVD Any Entry: Identifies either a bullish or bearish entry condition.
Alerts follow the selected entry mode and confirmation settings.
For confirmed signals, enable candle-close confirmation and select Once Per Bar Close in the TradingView alert configuration.
━━━━━━━━━━━━━━━━━━━━━━━━━━
12. IMPORTANT INFORMATION AND LIMITATIONS
━━━━━━━━━━━━━━━━━━━━━━━━━━
- Estimated volume delta is based on candle direction, not direct bid/ask trade classification.
- Doji candles are treated as negative volume in the current calculation.
- The cumulative volume calculation does not automatically reset each trading session.
- Normalization may be unavailable when momentum standard deviation is zero or insufficient historical data exists.
- The current histogram can change while the active candle develops.
- Disabling candle-close confirmation allows entry signals to appear or disappear intrabar.
- Higher momentum readings do not guarantee profitable price movement.
- Entry markers do not account for broader market structure, transaction costs, stop-loss placement, or trade execution.
- RSI filtering may substantially change the frequency and nature of trading signals.
The indicator is intended to support technical analysis rather than replace price-action confirmation or risk management.
━━━━━━━━━━━━━━━━━━━━━━━━━━
CONCLUSION
━━━━━━━━━━━━━━━━━━━━━━━━━━
The [CT] Advanced CVD Histogram with Entry Signals combines estimated cumulative volume delta, normalized momentum analysis, configurable BUY and SELL conditions, and optional chart visualization features into one trading tool.
By displaying momentum strength through a color-coded histogram, marking qualifying entry conditions directly on price candles, and optionally coloring those candles to match the histogram, the indicator provides a visual method for evaluating bullish and bearish momentum.
Whether analyzing trend continuation, potential reversals, or changes in volume momentum, the indicator is designed to complement a structured approach to trading.
Follow the structure. Evaluate the momentum. Confirm the entry. Manage the risk.
DISCLAIMER
This indicator is provided for educational and technical-analysis purposes only. It is not financial advice and does not guarantee profitable trading results. All trading involves risk, including the possibility of substantial financial loss.

Declinazione di responsabilità
Le informazioni e le pubblicazioni non sono intese come, e non costituiscono, consulenza o raccomandazioni finanziarie, di investimento, di trading o di altro tipo fornite o approvate da TradingView. Per ulteriori informazioni, consultare i Termini di utilizzo.
Declinazione di responsabilità
Le informazioni e le pubblicazioni non sono intese come, e non costituiscono, consulenza o raccomandazioni finanziarie, di investimento, di trading o di altro tipo fornite o approvate da TradingView. Per ulteriori informazioni, consultare i Termini di utilizzo.