OPEN-SOURCE SCRIPT
Power of Three [FEELS]
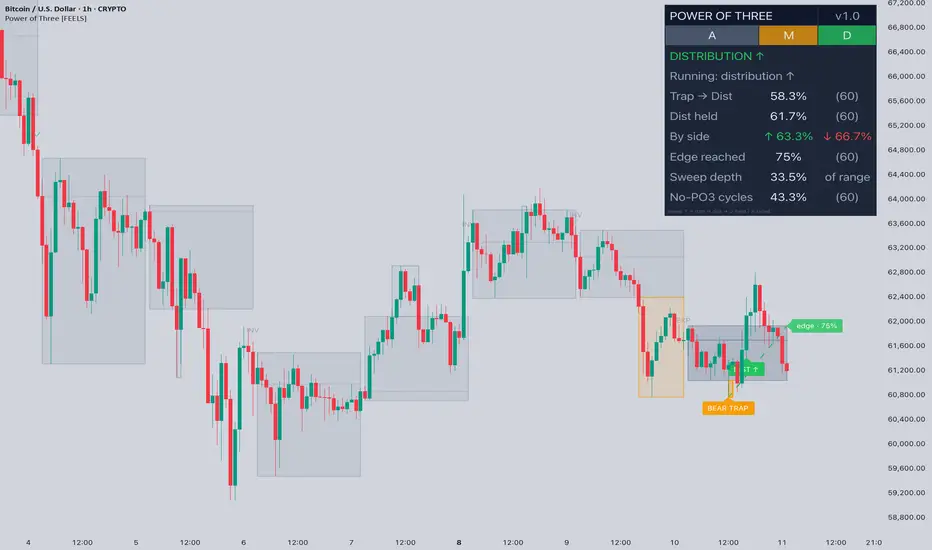
Every cycle tells the same story in three phases( Accumulation → Manipulation → Distribution): a range builds around the open, one side of it gets swept, and price moves the other way. Power of Three detects each phase of this cycle in real time, marks the trap the moment it confirms, and shows the historical odds of every outcome on the exact symbol and timeframe you are viewing.

OVERVIEW
Power of Three is an automated detector of the Accumulation → Manipulation → Distribution cycle (AMD / PO3). Each cycle period (daily by default, weekly optional) is analyzed as a three-phase sequence: an accumulation range forms around the cycle open, one side of the range gets swept, and price distributes in the opposite direction. The script classifies these phases live, draws the projected path of the active cycle, and maintains transparent statistics of how the pattern has resolved historically.
This is a phase classification and statistics tool. It does not generate buy or sell signals.
WHAT MAKES IT ORIGINAL
1. Event-driven phases instead of fixed time windows. PO3 tools commonly slice the cycle into preset time segments and expect each phase to arrive on schedule. Here phases are classified by what price does, through explicit transitions: range building → range set → sweep (pending) → trap confirmed → distribution. A trap is recognized whenever it occurs within the cycle, and a cycle without one is never forced into the pattern. A sweep that never reverses is classified as an expansion cycle. A confirmed trap that gets reclaimed is marked invalidated. Both are excluded from pattern statistics instead of being silently counted as wins or losses.
2. A built-in track record. Every completed cycle is stamped on the chart: ✓ when distribution held into the cycle close, ✗ when it failed, EXP for expansion cycles, INV for invalidated traps. The dashboard reports trap-to-distribution conversion, distribution hold rate, per-side hold rates, opposite-edge reach rate, and average sweep depth — computed from every resolved cycle over a configurable lookback, with sample sizes shown next to each figure.
3. A projected path with live statistics. When a trap is confirmed, the script draws the expected path from the sweep extreme to the cycle open, then to the opposite range edge once distribution triggers. The target label shows the historical frequency of that outcome on the current chart and updates as new cycles resolve.

HOW IT WORKS
Accumulation range. The high and low of the first portion of the cycle (default 25% of the cycle length). The window is measured in bars of the previous completed cycle, so instruments with session gaps are handled correctly. Once the window elapses, the range locks.
Sweep. Price exceeding a locked range boundary registers a pending sweep. An optional filter additionally requires the sweep to take the previous cycle high or low. An optional buffer sets a minimum penetration distance as a percent of the range.
Trap confirmation. A close back inside the range confirms the trap. An alternative confirmation mode uses a 50% retrace of the sweep depth, which behaves more consistently across chart timeframes.
Invalidation. After confirmation, a close beyond the original sweep extreme reclassifies the cycle as trend continuation. The zone is dimmed and the cycle is excluded from pattern statistics.
Distribution. A close across the cycle open against the sweep direction starts the distribution phase. At cycle close the outcome is recorded: held (closed on the distribution side of the open) or failed.
DASHBOARD
🧭 A / M / D progress cells show the current phase of the live cycle
🔁 Trap → Dist: share of confirmed traps that reached the distribution trigger
✅ Dist held: share of distributions that held into the cycle close
⚖️ By side: hold rates for upward and downward distributions separately
🎯 Edge reached: share of distributions that touched the opposite range edge before cycle close
📏 Sweep depth: average sweep penetration as a percent of the accumulation range
🚫 No-PO3 cycles: share of cycles resolved as expansion or invalidated
All statistics are historical frequencies over the selected lookback. They are specific to the instrument and timeframe on the chart and change as new cycles resolve.

DISPLAY
Two label styles: Descriptive (SWEEP ↑ ?, BULL TRAP, BEAR TRAP, DIST ↑/↓) and Compact (M?, M ✓, D) for traders who prefer classic AMD notation. History Detail in Results Only mode fades completed cycles and keeps only outcome markers, leaving the live cycle as the focal point. Accumulation ranges, manipulation zones, cycle open lines, the projected path, line widths and styles, marker sizes, colors, and dashboard position are configurable.

ALERTS
- Sweep Detected — a range boundary has been taken
- Manipulation Confirmed — price closed back inside the range
- Distribution Started — close crossed the cycle open against the sweep
- Manipulation Invalidated — the sweep extreme was reclaimed
NOTES
Works on any symbol. Daily cycles require an intraday chart; weekly cycles require a chart below 1W. A meaningful share of cycles resolves without a complete PO3 sequence and is excluded from pattern statistics by design — the cycle does not occur every day, and the script does not force it. Past frequencies do not guarantee future outcomes. Use as one component of analysis within a complete trading process.
OVERVIEW
Power of Three is an automated detector of the Accumulation → Manipulation → Distribution cycle (AMD / PO3). Each cycle period (daily by default, weekly optional) is analyzed as a three-phase sequence: an accumulation range forms around the cycle open, one side of the range gets swept, and price distributes in the opposite direction. The script classifies these phases live, draws the projected path of the active cycle, and maintains transparent statistics of how the pattern has resolved historically.
This is a phase classification and statistics tool. It does not generate buy or sell signals.
WHAT MAKES IT ORIGINAL
1. Event-driven phases instead of fixed time windows. PO3 tools commonly slice the cycle into preset time segments and expect each phase to arrive on schedule. Here phases are classified by what price does, through explicit transitions: range building → range set → sweep (pending) → trap confirmed → distribution. A trap is recognized whenever it occurs within the cycle, and a cycle without one is never forced into the pattern. A sweep that never reverses is classified as an expansion cycle. A confirmed trap that gets reclaimed is marked invalidated. Both are excluded from pattern statistics instead of being silently counted as wins or losses.
2. A built-in track record. Every completed cycle is stamped on the chart: ✓ when distribution held into the cycle close, ✗ when it failed, EXP for expansion cycles, INV for invalidated traps. The dashboard reports trap-to-distribution conversion, distribution hold rate, per-side hold rates, opposite-edge reach rate, and average sweep depth — computed from every resolved cycle over a configurable lookback, with sample sizes shown next to each figure.
3. A projected path with live statistics. When a trap is confirmed, the script draws the expected path from the sweep extreme to the cycle open, then to the opposite range edge once distribution triggers. The target label shows the historical frequency of that outcome on the current chart and updates as new cycles resolve.
HOW IT WORKS
Accumulation range. The high and low of the first portion of the cycle (default 25% of the cycle length). The window is measured in bars of the previous completed cycle, so instruments with session gaps are handled correctly. Once the window elapses, the range locks.
Sweep. Price exceeding a locked range boundary registers a pending sweep. An optional filter additionally requires the sweep to take the previous cycle high or low. An optional buffer sets a minimum penetration distance as a percent of the range.
Trap confirmation. A close back inside the range confirms the trap. An alternative confirmation mode uses a 50% retrace of the sweep depth, which behaves more consistently across chart timeframes.
Invalidation. After confirmation, a close beyond the original sweep extreme reclassifies the cycle as trend continuation. The zone is dimmed and the cycle is excluded from pattern statistics.
Distribution. A close across the cycle open against the sweep direction starts the distribution phase. At cycle close the outcome is recorded: held (closed on the distribution side of the open) or failed.
DASHBOARD
🧭 A / M / D progress cells show the current phase of the live cycle
🔁 Trap → Dist: share of confirmed traps that reached the distribution trigger
✅ Dist held: share of distributions that held into the cycle close
⚖️ By side: hold rates for upward and downward distributions separately
🎯 Edge reached: share of distributions that touched the opposite range edge before cycle close
📏 Sweep depth: average sweep penetration as a percent of the accumulation range
🚫 No-PO3 cycles: share of cycles resolved as expansion or invalidated
All statistics are historical frequencies over the selected lookback. They are specific to the instrument and timeframe on the chart and change as new cycles resolve.
DISPLAY
Two label styles: Descriptive (SWEEP ↑ ?, BULL TRAP, BEAR TRAP, DIST ↑/↓) and Compact (M?, M ✓, D) for traders who prefer classic AMD notation. History Detail in Results Only mode fades completed cycles and keeps only outcome markers, leaving the live cycle as the focal point. Accumulation ranges, manipulation zones, cycle open lines, the projected path, line widths and styles, marker sizes, colors, and dashboard position are configurable.
ALERTS
- Sweep Detected — a range boundary has been taken
- Manipulation Confirmed — price closed back inside the range
- Distribution Started — close crossed the cycle open against the sweep
- Manipulation Invalidated — the sweep extreme was reclaimed
NOTES
Works on any symbol. Daily cycles require an intraday chart; weekly cycles require a chart below 1W. A meaningful share of cycles resolves without a complete PO3 sequence and is excluded from pattern statistics by design — the cycle does not occur every day, and the script does not force it. Past frequencies do not guarantee future outcomes. Use as one component of analysis within a complete trading process.
Script open-source
Nello spirito di TradingView, l'autore di questo script lo ha reso open source, in modo che i trader possano esaminarne e verificarne la funzionalità. Complimenti all'autore! Sebbene sia possibile utilizzarlo gratuitamente, ricordiamo che la ripubblicazione del codice è soggetta al nostro Regolamento.

💰Free Channel — t.me/FeelsStrategy
🤵For more info contact — t.me/VolodymyrFeels
🔗 Links — feelsstrategy.com/links
🤵For more info contact — t.me/VolodymyrFeels
🔗 Links — feelsstrategy.com/links
Declinazione di responsabilità
Le informazioni e le pubblicazioni non sono intese come, e non costituiscono, consulenza o raccomandazioni finanziarie, di investimento, di trading o di altro tipo fornite o approvate da TradingView. Per ulteriori informazioni, consultare i Termini di utilizzo.
Script open-source
Nello spirito di TradingView, l'autore di questo script lo ha reso open source, in modo che i trader possano esaminarne e verificarne la funzionalità. Complimenti all'autore! Sebbene sia possibile utilizzarlo gratuitamente, ricordiamo che la ripubblicazione del codice è soggetta al nostro Regolamento.
💰Free Channel — t.me/FeelsStrategy
🤵For more info contact — t.me/VolodymyrFeels
🔗 Links — feelsstrategy.com/links
🤵For more info contact — t.me/VolodymyrFeels
🔗 Links — feelsstrategy.com/links
Declinazione di responsabilità
Le informazioni e le pubblicazioni non sono intese come, e non costituiscono, consulenza o raccomandazioni finanziarie, di investimento, di trading o di altro tipo fornite o approvate da TradingView. Per ulteriori informazioni, consultare i Termini di utilizzo.