Valuation
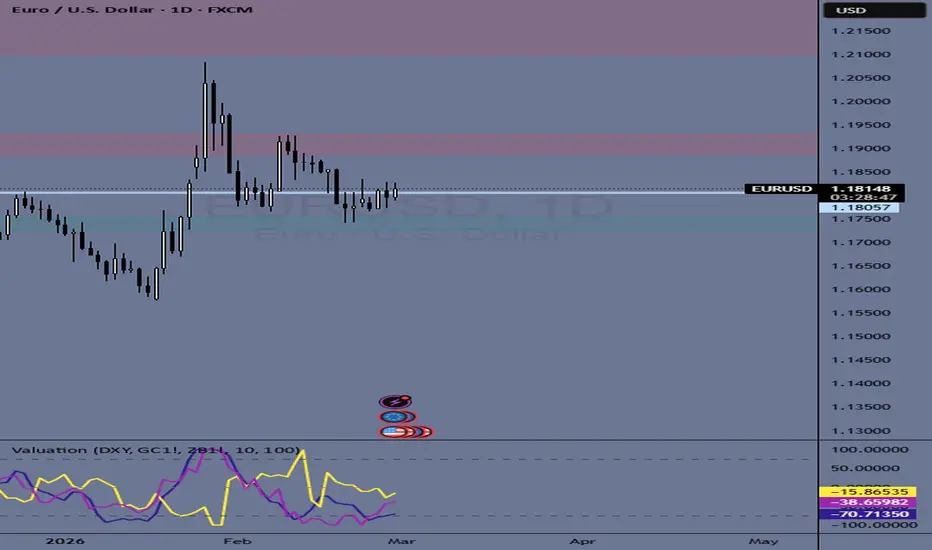
Valuation is a relative performance and mean-reversion indicator designed to measure how overvalued or undervalued the current chart symbol is compared to up to three benchmark assets.
By default, it compares price behavior against:
U.S. Dollar Index (DXY)
Gold Futures (GC1!)
U.S. Treasury Bond Futures (ZB1!)
All comparison symbols are fully customizable.
🔎 What It Does
The indicator:
Calculates the percentage change over a selected lookback period (default: 10 bars) for:
The current chart symbol
Three selected benchmark symbols
Computes the performance difference:
Relative Difference = Symbol % Change − Benchmark % Change
Rescales the difference over a longer rolling window (default: 100 bars) into a normalized range between:
-100 → +100
This normalization allows consistent interpretation across different assets and timeframes.
📊 How to Interpret
Above +75 → Potentially overvalued vs. benchmark
Below -75 → Potentially undervalued vs. benchmark
Near 0 → Fair relative value
Because it measures relative performance, this is not a traditional oscillator. It highlights divergence and excess movement compared to macro drivers or reference markets.
🧠 Practical Use Cases
Traders use this indicator to:
Detect stretched moves vs. macro assets
Identify mean-reversion opportunities
Spot cross-asset divergence
Confirm or fade momentum extremes
Evaluate whether price action is justified by external drivers
For example:
If EURUSD strongly outperforms DXY but DXY is stable, the pair may be overstretched.
If gold lags bonds during risk-off flows, it may signal temporary mispricing.
⚙️ Customization
Choose any three comparison symbols
Adjust percentage lookback length
Adjust rescaling window
Works on any timeframe
🎯 Core Idea
Markets rarely move in isolation.
This tool helps you determine whether price action is aligned with broader intermarket flows — or temporarily disconnected.
Used properly, it becomes a powerful relative value filter rather than just another oscillator.
By default, it compares price behavior against:
U.S. Dollar Index (DXY)
Gold Futures (GC1!)
U.S. Treasury Bond Futures (ZB1!)
All comparison symbols are fully customizable.
🔎 What It Does
The indicator:
Calculates the percentage change over a selected lookback period (default: 10 bars) for:
The current chart symbol
Three selected benchmark symbols
Computes the performance difference:
Relative Difference = Symbol % Change − Benchmark % Change
Rescales the difference over a longer rolling window (default: 100 bars) into a normalized range between:
-100 → +100
This normalization allows consistent interpretation across different assets and timeframes.
📊 How to Interpret
Above +75 → Potentially overvalued vs. benchmark
Below -75 → Potentially undervalued vs. benchmark
Near 0 → Fair relative value
Because it measures relative performance, this is not a traditional oscillator. It highlights divergence and excess movement compared to macro drivers or reference markets.
🧠 Practical Use Cases
Traders use this indicator to:
Detect stretched moves vs. macro assets
Identify mean-reversion opportunities
Spot cross-asset divergence
Confirm or fade momentum extremes
Evaluate whether price action is justified by external drivers
For example:
If EURUSD strongly outperforms DXY but DXY is stable, the pair may be overstretched.
If gold lags bonds during risk-off flows, it may signal temporary mispricing.
⚙️ Customization
Choose any three comparison symbols
Adjust percentage lookback length
Adjust rescaling window
Works on any timeframe
🎯 Core Idea
Markets rarely move in isolation.
This tool helps you determine whether price action is aligned with broader intermarket flows — or temporarily disconnected.
Used properly, it becomes a powerful relative value filter rather than just another oscillator.

Declinazione di responsabilità
Le informazioni e le pubblicazioni non sono intese come, e non costituiscono, consulenza o raccomandazioni finanziarie, di investimento, di trading o di altro tipo fornite o approvate da TradingView. Per ulteriori informazioni, consultare i Termini di utilizzo.
Declinazione di responsabilità
Le informazioni e le pubblicazioni non sono intese come, e non costituiscono, consulenza o raccomandazioni finanziarie, di investimento, di trading o di altro tipo fornite o approvate da TradingView. Per ulteriori informazioni, consultare i Termini di utilizzo.