OPEN-SOURCE SCRIPT
Aggiornato Average Price / Time
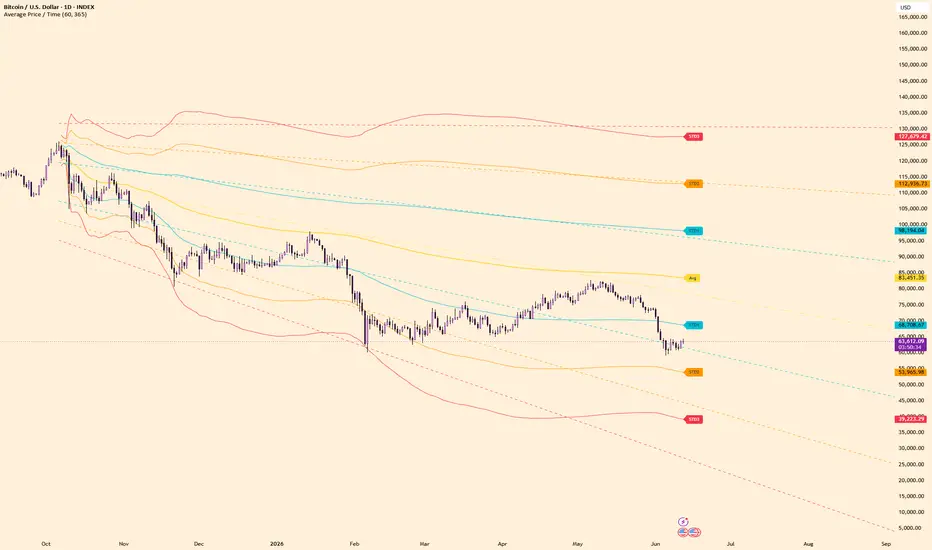
Average Price / Time calculates an anchored time-at-price average from a selected starting candle.
The script uses 1-hour candle ranges by default and treats time as evenly distributed across each candle’s high-low range. From the selected anchor point, it calculates the average price and plots standard deviation bands around it.
Features:
- Mouse-selected start candle
- Time-at-price average
- STD1, STD2, and STD3 bands
- Current z-score shown in the data window
Note:
This is a time-at-price approximation, not a volume-weighted calculation. It measures where price spent time, not where the most volume traded.
The script uses 1-hour candle ranges by default and treats time as evenly distributed across each candle’s high-low range. From the selected anchor point, it calculates the average price and plots standard deviation bands around it.
Features:
- Mouse-selected start candle
- Time-at-price average
- STD1, STD2, and STD3 bands
- Current z-score shown in the data window
Note:
This is a time-at-price approximation, not a volume-weighted calculation. It measures where price spent time, not where the most volume traded.
Note di rilascio
Added linear-regression projection tools for Avg and standard deviation levels.The indicator now calculates regression slopes for Avg, STD1, STD2, and STD3 levels from the anchored period and draws forward projection lines based on those fitted trends.
Projection length is user configurable, and projected slopes are available in the data window.
Script open-source
Nello spirito di TradingView, l'autore di questo script lo ha reso open source, in modo che i trader possano esaminarne e verificarne la funzionalità. Complimenti all'autore! Sebbene sia possibile utilizzarlo gratuitamente, ricordiamo che la ripubblicazione del codice è soggetta al nostro Regolamento.

Declinazione di responsabilità
Le informazioni e le pubblicazioni non sono intese come, e non costituiscono, consulenza o raccomandazioni finanziarie, di investimento, di trading o di altro tipo fornite o approvate da TradingView. Per ulteriori informazioni, consultare i Termini di utilizzo.
Script open-source
Nello spirito di TradingView, l'autore di questo script lo ha reso open source, in modo che i trader possano esaminarne e verificarne la funzionalità. Complimenti all'autore! Sebbene sia possibile utilizzarlo gratuitamente, ricordiamo che la ripubblicazione del codice è soggetta al nostro Regolamento.
Declinazione di responsabilità
Le informazioni e le pubblicazioni non sono intese come, e non costituiscono, consulenza o raccomandazioni finanziarie, di investimento, di trading o di altro tipo fornite o approvate da TradingView. Per ulteriori informazioni, consultare i Termini di utilizzo.