3D Opportunity Cone [LuxAlgo]
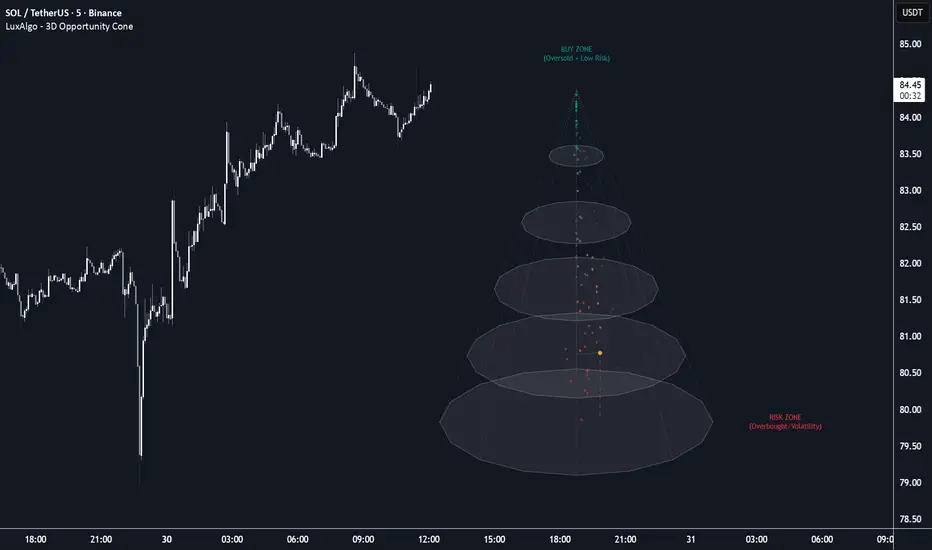
The 3D Opportunity Cone indicator is a multi-dimensional visualization tool that maps market conditions into a 3D geometric space to identify high-value, low-risk entry points. By synthesizing price action, volatility, and volume into a single spatial model, it allows traders to visualize the "distance" between current market states and optimal buying conditions.
🔶 USAGE
The indicator projects a 3D cone onto the right side of the chart, representing a theoretical "Opportunity Space." A historical trail of dots moves through this space, showing how the market's internal mechanics have evolved over time.
🔹 The 3D Coordinate System
The position of the market "point" within the cone is determined by three distinct factors:
🔹 Interpreting the Zones
The "Buy Zone" is located at the apex (top) of the cone. An ideal opportunity occurs when the market point is high (Value), centered (Low Risk), and supported by conviction. Conversely, the "Risk Zone" at the base of the cone represents overbought or high-volatility conditions where caution is required.
🔶 DETAILS
The script uses a custom projection engine to convert 3D coordinates (X, Y, Z) into 2D chart space. The "Opportunity Space" is anchored to a Simple Moving Average (SMA) to provide a localized context for the visualization.
The historical trail provides a temporal dimension, allowing users to see if the market is spiraling toward a value zone or drifting away into a high-risk state. The trail colors fade from red (High Risk/Overbought) to green (High Value/Oversold) to provide an immediate visual cue of market health.
🔶 SETTINGS
🔹 Cone Settings
🔹 Trail & Colors
🔶 USAGE
The indicator projects a 3D cone onto the right side of the chart, representing a theoretical "Opportunity Space." A historical trail of dots moves through this space, showing how the market's internal mechanics have evolved over time.
🔹 The 3D Coordinate System
The position of the market "point" within the cone is determined by three distinct factors:
- Height (Value Factor): Derived from the Stochastic oscillator. Higher positions in the cone represent oversold (value) conditions, while lower positions represent overbought states.
- Radius (Risk Factor): Derived from the Average True Range (ATR). Points closer to the center of the cone represent lower volatility risk, while points pushed toward the outer edges indicate high-volatility environments.
- Angle (Conviction Factor): Derived from Normalized Volume. The rotation around the central axis indicates the level of market participation and conviction behind the current price movement.
🔹 Interpreting the Zones
The "Buy Zone" is located at the apex (top) of the cone. An ideal opportunity occurs when the market point is high (Value), centered (Low Risk), and supported by conviction. Conversely, the "Risk Zone" at the base of the cone represents overbought or high-volatility conditions where caution is required.
🔶 DETAILS
The script uses a custom projection engine to convert 3D coordinates (X, Y, Z) into 2D chart space. The "Opportunity Space" is anchored to a Simple Moving Average (SMA) to provide a localized context for the visualization.
The historical trail provides a temporal dimension, allowing users to see if the market is spiraling toward a value zone or drifting away into a high-risk state. The trail colors fade from red (High Risk/Overbought) to green (High Value/Oversold) to provide an immediate visual cue of market health.
🔶 SETTINGS
🔹 Cone Settings
- Evaluation Lookback: The period used for calculating the Stochastic, ATR, and Volume normalization.
- Cone Scale: Adjusts the visual size of the 3D cone on the chart.
- X Offset (Bars): Determines how many bars to the right of the current price the cone is rendered.
- 3D Tilt: Adjusts the perspective/inclination of the 3D projection.
🔹 Trail & Colors
- Highlight Color: The color of the current market point and its projection lines.
- Cone Fill Color: The background color of the cone's surface.
- Trail Length: The number of historical periods to display within the 3D space.

All content & scripts provided by LuxAlgo are for educational purposes only and are not financial advice.
Declinazione di responsabilità
Le informazioni e le pubblicazioni non sono intese come, e non costituiscono, consulenza o raccomandazioni finanziarie, di investimento, di trading o di altro tipo fornite o approvate da TradingView. Per ulteriori informazioni, consultare i Termini di utilizzo.
Declinazione di responsabilità
Le informazioni e le pubblicazioni non sono intese come, e non costituiscono, consulenza o raccomandazioni finanziarie, di investimento, di trading o di altro tipo fornite o approvate da TradingView. Per ulteriori informazioni, consultare i Termini di utilizzo.