Aggiornato
MACD Momentum Phase & Acceleration Observatory
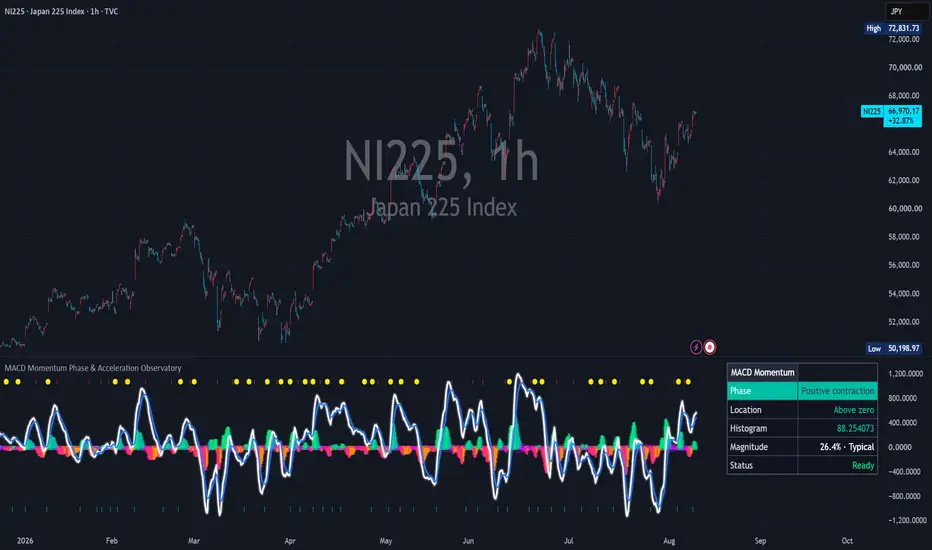
MACD Momentum Phase & Acceleration Observatory is a current-chart momentum research indicator that extends the familiar MACD line, Signal line, and Histogram into a structured view of separation, expansion, contraction, equilibrium, relative magnitude, and crossover-cycle behavior.
The script is designed for users who want to study how MACD momentum changes rather than rely only on a line crossover. It is a descriptive context tool. It does not generate Buy or Sell instructions, predict future price movement, estimate win rate, or manage risk.
WHAT IT SHOWS
- A configurable MACD line, Signal line, and state-colored Histogram.
- Five descriptive momentum phases.
- A noise-aware expansion and contraction model.
- An adaptive Near Equilibrium state with separate entry and exit boundaries.
- Three display scales: Raw MACD, Percent of Slow Average, and ATR Units.
- A robust rolling Histogram magnitude score.
- A subdued-to-reactivated magnitude sequence.
- Cross-cycle peak retention.
- MACD path efficiency.
- A compact or detailed context readout.
- Optional factual event markers and alert conditions.
WHY THIS IS MORE THAN A STANDARD MACD
A standard MACD primarily shows the relationship between a fast moving average, a slow moving average, and a smoothed Signal line. This script keeps that familiar structure, but its main contribution is a coordinated lifecycle model built around the MACD Histogram.
The distinguishing design consists of:
- separating the raw analytical engine from display normalization;
- classifying the Histogram into five momentum phases;
- filtering small expansion/contraction changes with an adaptive noise deadband;
- reducing equilibrium-boundary flapping with entry/exit hysteresis;
- measuring relative Histogram magnitude with rank-based methods;
- tracking reactivation after a sustained subdued sequence;
- measuring how much Histogram separation remains inside the active crossover cycle; and
- measuring whether the MACD path has been direct or rotational over a selected lookback.
These components are designed to describe different parts of one MACD separation lifecycle. They are not independent indicators combined without a shared purpose.
CORE MACD ENGINE
The raw calculations are:
Raw MACD = Fast Moving Average - Slow Moving Average
Raw Signal = Moving Average of Raw MACD
Raw Histogram = Raw MACD - Raw Signal
The Fast, Slow, and Signal calculations can each use one of the following moving-average methods:
- EMA
- SMA
- RMA
- WMA
- HMA
The source and all lengths are configurable. Fast Length must remain lower than Slow Length. If the configuration is invalid or the selected scale is unavailable, the context readout reports the condition instead of presenting a normal Ready state.
RAW ANALYTICAL CORE AND DISPLAY SCALE
The analytical state is calculated from the raw MACD structure. Display normalization is handled separately.
Available display modes are:
Raw MACD
Shows the MACD components in their native chart-price units.
Percent of Slow Average
Divides MACD, Signal, and Histogram by one percent of the absolute Slow Average value.
ATR Units
Divides MACD, Signal, and Histogram by the current ATR value using the selected ATR length.
The same positive divisor is applied to all three displayed components on each bar. More importantly, crossover events, zero crossings, phase classification, magnitude scoring, path efficiency, and cycle retention are calculated from the raw series. Changing the display mode therefore changes the visual unit, but it does not rewrite the underlying analytical event history.
FIVE-STATE MOMENTUM PHASE MODEL
The Histogram is classified into five descriptive states:
Positive Expansion
The raw Histogram is above zero and its absolute magnitude is expanding beyond the adaptive noise deadband.
Positive Contraction
The raw Histogram is above zero and its absolute magnitude is contracting.
Negative Expansion
The raw Histogram is below zero and its absolute magnitude is expanding.
Negative Contraction
The raw Histogram is below zero and its absolute magnitude is contracting.
Near Equilibrium
The absolute raw Histogram is inside the adaptive equilibrium boundary.
Expansion and contraction are based on the smoothed one-bar change in absolute Histogram magnitude. The script also estimates ordinary recent one-bar magnitude movement. That estimate creates an adaptive deadband. When the current magnitude change is too small to distinguish clearly from recent noise, the prior motion state is retained instead of forcing another Expansion/Contraction switch.
ADAPTIVE EQUILIBRIUM WITH HYSTERESIS
The equilibrium entry boundary is calculated from an EMA of the absolute raw Histogram multiplied by the Equilibrium Band Multiplier.
Once Near Equilibrium is active, the exit boundary is wider than the entry boundary:
Exit Boundary = Entry Boundary x Equilibrium Exit Hysteresis
Using separate entry and exit boundaries reduces rapid state changes when the Histogram repeatedly moves just above and below one threshold.
HISTOGRAM ACCELERATION
Histogram Acceleration is the smoothed one-bar change of the Histogram. The detailed readout can display the current value and direction. Optional acceleration-turn markers and alerts identify factual zero crossings in the raw acceleration measure.
The acceleration value shown in the readout follows the selected display unit. The five-state phase model remains based on the raw Histogram structure.
ROBUST HISTOGRAM MAGNITUDE SCORE
The Magnitude field measures the current absolute raw Histogram relative to its own recent history. It is bounded from 0 to 100 and offers three methods:
Percent Rank
Ranks the current absolute Histogram among observations in the selected lookback. This method is less dominated by one isolated extreme value.
Range Rank
Locates the current absolute Histogram between the rolling minimum and rolling maximum.
Hybrid Rank
Combines 65 percent Percent Rank with 35 percent Range Rank. This is the default method.
The score is classified as:
- Subdued
- Typical
- Extended
These labels describe relative recent magnitude only. They are not probabilities, confidence levels, overbought/oversold signals, or forecasts.
MAGNITUDE REACTIVATION
Magnitude Reactivation is a stateful sequence, not a directional trade signal.
The sequence works as follows:
1. The Magnitude score remains at or below the Subdued threshold for at least the selected Minimum Subdued Bars.
2. The reactivation condition becomes armed.
3. A reactivation event is recorded when the score reaches the Magnitude Reactivation threshold.
The default visual marker is a small yellow dot at the top of the pane. It indicates that relative Histogram magnitude has re-emerged after a sustained subdued sequence. It does not specify bullish or bearish direction.
CROSS-CYCLE PEAK RETENTION
A cross cycle begins whenever the raw MACD line crosses the raw Signal line.
During the active cycle, the script records the largest absolute raw Histogram magnitude. Cross-Cycle Peak Retention is calculated as:
Current Absolute Histogram / Active-Cycle Peak Absolute Histogram x 100
A value near 100 means the current separation is near the largest separation recorded in that crossover cycle. A lower value means more of that cycle's peak separation has contracted. This measurement is descriptive and does not determine whether price will continue or reverse.
MACD PATH EFFICIENCY
MACD Path Efficiency compares the net displacement of the raw MACD line with the total distance traveled by the raw MACD line over the selected lookback:
Absolute Net MACD Displacement / Sum of Absolute One-Bar MACD Changes x 100
A higher value describes a more direct MACD path. A lower value describes a more rotational or back-and-forth path. It is not a measure of profitability, trend quality, or future reliability.
CONTEXT READOUT
The Context Readout can be disabled or shown in Compact or Detailed mode.
Compact mode shows:
- Phase
- Location relative to zero
- Histogram value
- Magnitude score and state
- Configuration status
Detailed mode additionally shows:
- Histogram Acceleration
- Phase Age
- Bars in the active cross cycle and Peak Retention
- MACD Path Efficiency
- Confirmed or Live bar status
The table position, text size, header size, background, border, and row presentation are configurable.
VISUAL DESIGN
The default palette separates the line family from the Histogram family:
- MACD line: ice white
- Signal line: electric blue
- Positive Expansion: bright green
- Positive Contraction: teal
- Negative Expansion: magenta
- Negative Contraction: orange
- Near Equilibrium: vivid purple
- Magnitude Reactivation: yellow
The Histogram uses a depth layer and a narrower core layer. The MACD and Signal lines can use optional glow and separation fill. The adaptive equilibrium band, zero guide, phase rail, and background tint can be enabled or disabled independently.
EVENT MARKERS AND ALERTS
Default factual markers are:
- a small upward arrow at the pane bottom when MACD crosses above Signal;
- a small downward arrow at the pane top when MACD crosses below Signal; and
- a small yellow dot at the pane top when Magnitude Reactivation occurs.
Optional markers are available for:
- Histogram Acceleration turning positive or negative; and
- MACD crossing above or below zero.
Alert conditions are available for the same events and for each phase transition. These events describe calculated state changes. They are not trade-entry or trade-exit recommendations.
REALTIME AND CONFIRMED-BAR BEHAVIOR
Confirmed Bars Only is enabled by default.
With the default setting:
- markers and alert conditions trigger after the chart bar closes;
- stateful Magnitude Reactivation updates are committed on confirmed realtime bars; and
- the committed cross-cycle peak is updated on confirmed realtime bars.
The MACD lines, Histogram, phase display, and context readout can still change while the current bar is forming because their inputs change with live price. This is normal realtime behavior. Users who disable Confirmed Bars Only intentionally allow intrabar events, which can change before the bar closes.
The script uses the current chart timeframe only. It does not request another symbol or timeframe, use lookahead, access future data, or apply a future plot offset.
HOW TO USE THE INDICATOR
1. Start with Location and Phase.
Location shows whether raw MACD is above or below zero. Phase shows whether Histogram magnitude is expanding, contracting, or near equilibrium.
2. Add Magnitude context.
Use Subdued, Typical, and Extended as rolling relative-magnitude descriptions. Do not interpret them as probabilities.
3. Observe reactivation after subdued conditions.
A yellow dot identifies a transition from a sustained subdued sequence to a higher relative magnitude. Read its direction from the Histogram sign and phase, not from the dot itself.
4. Use Detailed mode for lifecycle context.
Phase Age shows duration. Cross-Cycle Peak Retention shows how much separation remains relative to the active cycle peak. Path Efficiency shows whether the MACD path has been direct or rotational.
5. Select a suitable display unit.
Raw MACD preserves native units. Percent of Slow Average and ATR Units can make the pane easier to read on symbols with different price or volatility scales. Analytical states remain based on raw MACD.
DEFAULT CONFIGURATION
The default core uses 12-period EMA, 26-period EMA, and a 9-period EMA Signal line with Close as the source.
The default research settings use:
- Raw MACD display
- 3-bar acceleration smoothing
- 8-bar phase-noise estimation
- 0.25 phase-noise multiplier
- 34-bar adaptive equilibrium basis
- 0.28 equilibrium entry multiplier
- 1.25 equilibrium exit hysteresis
- 120-bar Hybrid Magnitude Rank
- 20 / 35 / 80 Subdued, Reactivation, and Extended thresholds
- 3 Minimum Subdued Bars
- 20-bar MACD Path Efficiency
- Compact Context Readout
- Confirmed Bars Only enabled
The defaults are general starting points, not optimized settings for a specific symbol or timeframe.
LIMITATIONS
- MACD is derived from moving averages and therefore contains lag.
- Expansion, contraction, equilibrium, magnitude, retention, and efficiency describe the current and historical calculation state; they do not forecast price.
- Results depend on the selected source, moving-average methods, lengths, smoothing, lookbacks, and thresholds.
- Rank-based measurements are relative to a rolling window and can change as old observations leave that window.
- Frequent MACD/Signal crossings create shorter cross cycles and can make Peak Retention change quickly.
- Low-liquidity symbols, gaps, abrupt price changes, and very short timeframes can produce rapid state transitions.
- The open bar remains fluid until it closes.
- The script does not include position sizing, stop placement, targets, backtesting, or risk management.
Use the indicator as one transparent source of momentum context alongside independent price analysis and risk controls.
The script is designed for users who want to study how MACD momentum changes rather than rely only on a line crossover. It is a descriptive context tool. It does not generate Buy or Sell instructions, predict future price movement, estimate win rate, or manage risk.
WHAT IT SHOWS
- A configurable MACD line, Signal line, and state-colored Histogram.
- Five descriptive momentum phases.
- A noise-aware expansion and contraction model.
- An adaptive Near Equilibrium state with separate entry and exit boundaries.
- Three display scales: Raw MACD, Percent of Slow Average, and ATR Units.
- A robust rolling Histogram magnitude score.
- A subdued-to-reactivated magnitude sequence.
- Cross-cycle peak retention.
- MACD path efficiency.
- A compact or detailed context readout.
- Optional factual event markers and alert conditions.
WHY THIS IS MORE THAN A STANDARD MACD
A standard MACD primarily shows the relationship between a fast moving average, a slow moving average, and a smoothed Signal line. This script keeps that familiar structure, but its main contribution is a coordinated lifecycle model built around the MACD Histogram.
The distinguishing design consists of:
- separating the raw analytical engine from display normalization;
- classifying the Histogram into five momentum phases;
- filtering small expansion/contraction changes with an adaptive noise deadband;
- reducing equilibrium-boundary flapping with entry/exit hysteresis;
- measuring relative Histogram magnitude with rank-based methods;
- tracking reactivation after a sustained subdued sequence;
- measuring how much Histogram separation remains inside the active crossover cycle; and
- measuring whether the MACD path has been direct or rotational over a selected lookback.
These components are designed to describe different parts of one MACD separation lifecycle. They are not independent indicators combined without a shared purpose.
CORE MACD ENGINE
The raw calculations are:
Raw MACD = Fast Moving Average - Slow Moving Average
Raw Signal = Moving Average of Raw MACD
Raw Histogram = Raw MACD - Raw Signal
The Fast, Slow, and Signal calculations can each use one of the following moving-average methods:
- EMA
- SMA
- RMA
- WMA
- HMA
The source and all lengths are configurable. Fast Length must remain lower than Slow Length. If the configuration is invalid or the selected scale is unavailable, the context readout reports the condition instead of presenting a normal Ready state.
RAW ANALYTICAL CORE AND DISPLAY SCALE
The analytical state is calculated from the raw MACD structure. Display normalization is handled separately.
Available display modes are:
Raw MACD
Shows the MACD components in their native chart-price units.
Percent of Slow Average
Divides MACD, Signal, and Histogram by one percent of the absolute Slow Average value.
ATR Units
Divides MACD, Signal, and Histogram by the current ATR value using the selected ATR length.
The same positive divisor is applied to all three displayed components on each bar. More importantly, crossover events, zero crossings, phase classification, magnitude scoring, path efficiency, and cycle retention are calculated from the raw series. Changing the display mode therefore changes the visual unit, but it does not rewrite the underlying analytical event history.
FIVE-STATE MOMENTUM PHASE MODEL
The Histogram is classified into five descriptive states:
Positive Expansion
The raw Histogram is above zero and its absolute magnitude is expanding beyond the adaptive noise deadband.
Positive Contraction
The raw Histogram is above zero and its absolute magnitude is contracting.
Negative Expansion
The raw Histogram is below zero and its absolute magnitude is expanding.
Negative Contraction
The raw Histogram is below zero and its absolute magnitude is contracting.
Near Equilibrium
The absolute raw Histogram is inside the adaptive equilibrium boundary.
Expansion and contraction are based on the smoothed one-bar change in absolute Histogram magnitude. The script also estimates ordinary recent one-bar magnitude movement. That estimate creates an adaptive deadband. When the current magnitude change is too small to distinguish clearly from recent noise, the prior motion state is retained instead of forcing another Expansion/Contraction switch.
ADAPTIVE EQUILIBRIUM WITH HYSTERESIS
The equilibrium entry boundary is calculated from an EMA of the absolute raw Histogram multiplied by the Equilibrium Band Multiplier.
Once Near Equilibrium is active, the exit boundary is wider than the entry boundary:
Exit Boundary = Entry Boundary x Equilibrium Exit Hysteresis
Using separate entry and exit boundaries reduces rapid state changes when the Histogram repeatedly moves just above and below one threshold.
HISTOGRAM ACCELERATION
Histogram Acceleration is the smoothed one-bar change of the Histogram. The detailed readout can display the current value and direction. Optional acceleration-turn markers and alerts identify factual zero crossings in the raw acceleration measure.
The acceleration value shown in the readout follows the selected display unit. The five-state phase model remains based on the raw Histogram structure.
ROBUST HISTOGRAM MAGNITUDE SCORE
The Magnitude field measures the current absolute raw Histogram relative to its own recent history. It is bounded from 0 to 100 and offers three methods:
Percent Rank
Ranks the current absolute Histogram among observations in the selected lookback. This method is less dominated by one isolated extreme value.
Range Rank
Locates the current absolute Histogram between the rolling minimum and rolling maximum.
Hybrid Rank
Combines 65 percent Percent Rank with 35 percent Range Rank. This is the default method.
The score is classified as:
- Subdued
- Typical
- Extended
These labels describe relative recent magnitude only. They are not probabilities, confidence levels, overbought/oversold signals, or forecasts.
MAGNITUDE REACTIVATION
Magnitude Reactivation is a stateful sequence, not a directional trade signal.
The sequence works as follows:
1. The Magnitude score remains at or below the Subdued threshold for at least the selected Minimum Subdued Bars.
2. The reactivation condition becomes armed.
3. A reactivation event is recorded when the score reaches the Magnitude Reactivation threshold.
The default visual marker is a small yellow dot at the top of the pane. It indicates that relative Histogram magnitude has re-emerged after a sustained subdued sequence. It does not specify bullish or bearish direction.
CROSS-CYCLE PEAK RETENTION
A cross cycle begins whenever the raw MACD line crosses the raw Signal line.
During the active cycle, the script records the largest absolute raw Histogram magnitude. Cross-Cycle Peak Retention is calculated as:
Current Absolute Histogram / Active-Cycle Peak Absolute Histogram x 100
A value near 100 means the current separation is near the largest separation recorded in that crossover cycle. A lower value means more of that cycle's peak separation has contracted. This measurement is descriptive and does not determine whether price will continue or reverse.
MACD PATH EFFICIENCY
MACD Path Efficiency compares the net displacement of the raw MACD line with the total distance traveled by the raw MACD line over the selected lookback:
Absolute Net MACD Displacement / Sum of Absolute One-Bar MACD Changes x 100
A higher value describes a more direct MACD path. A lower value describes a more rotational or back-and-forth path. It is not a measure of profitability, trend quality, or future reliability.
CONTEXT READOUT
The Context Readout can be disabled or shown in Compact or Detailed mode.
Compact mode shows:
- Phase
- Location relative to zero
- Histogram value
- Magnitude score and state
- Configuration status
Detailed mode additionally shows:
- Histogram Acceleration
- Phase Age
- Bars in the active cross cycle and Peak Retention
- MACD Path Efficiency
- Confirmed or Live bar status
The table position, text size, header size, background, border, and row presentation are configurable.
VISUAL DESIGN
The default palette separates the line family from the Histogram family:
- MACD line: ice white
- Signal line: electric blue
- Positive Expansion: bright green
- Positive Contraction: teal
- Negative Expansion: magenta
- Negative Contraction: orange
- Near Equilibrium: vivid purple
- Magnitude Reactivation: yellow
The Histogram uses a depth layer and a narrower core layer. The MACD and Signal lines can use optional glow and separation fill. The adaptive equilibrium band, zero guide, phase rail, and background tint can be enabled or disabled independently.
EVENT MARKERS AND ALERTS
Default factual markers are:
- a small upward arrow at the pane bottom when MACD crosses above Signal;
- a small downward arrow at the pane top when MACD crosses below Signal; and
- a small yellow dot at the pane top when Magnitude Reactivation occurs.
Optional markers are available for:
- Histogram Acceleration turning positive or negative; and
- MACD crossing above or below zero.
Alert conditions are available for the same events and for each phase transition. These events describe calculated state changes. They are not trade-entry or trade-exit recommendations.
REALTIME AND CONFIRMED-BAR BEHAVIOR
Confirmed Bars Only is enabled by default.
With the default setting:
- markers and alert conditions trigger after the chart bar closes;
- stateful Magnitude Reactivation updates are committed on confirmed realtime bars; and
- the committed cross-cycle peak is updated on confirmed realtime bars.
The MACD lines, Histogram, phase display, and context readout can still change while the current bar is forming because their inputs change with live price. This is normal realtime behavior. Users who disable Confirmed Bars Only intentionally allow intrabar events, which can change before the bar closes.
The script uses the current chart timeframe only. It does not request another symbol or timeframe, use lookahead, access future data, or apply a future plot offset.
HOW TO USE THE INDICATOR
1. Start with Location and Phase.
Location shows whether raw MACD is above or below zero. Phase shows whether Histogram magnitude is expanding, contracting, or near equilibrium.
2. Add Magnitude context.
Use Subdued, Typical, and Extended as rolling relative-magnitude descriptions. Do not interpret them as probabilities.
3. Observe reactivation after subdued conditions.
A yellow dot identifies a transition from a sustained subdued sequence to a higher relative magnitude. Read its direction from the Histogram sign and phase, not from the dot itself.
4. Use Detailed mode for lifecycle context.
Phase Age shows duration. Cross-Cycle Peak Retention shows how much separation remains relative to the active cycle peak. Path Efficiency shows whether the MACD path has been direct or rotational.
5. Select a suitable display unit.
Raw MACD preserves native units. Percent of Slow Average and ATR Units can make the pane easier to read on symbols with different price or volatility scales. Analytical states remain based on raw MACD.
DEFAULT CONFIGURATION
The default core uses 12-period EMA, 26-period EMA, and a 9-period EMA Signal line with Close as the source.
The default research settings use:
- Raw MACD display
- 3-bar acceleration smoothing
- 8-bar phase-noise estimation
- 0.25 phase-noise multiplier
- 34-bar adaptive equilibrium basis
- 0.28 equilibrium entry multiplier
- 1.25 equilibrium exit hysteresis
- 120-bar Hybrid Magnitude Rank
- 20 / 35 / 80 Subdued, Reactivation, and Extended thresholds
- 3 Minimum Subdued Bars
- 20-bar MACD Path Efficiency
- Compact Context Readout
- Confirmed Bars Only enabled
The defaults are general starting points, not optimized settings for a specific symbol or timeframe.
LIMITATIONS
- MACD is derived from moving averages and therefore contains lag.
- Expansion, contraction, equilibrium, magnitude, retention, and efficiency describe the current and historical calculation state; they do not forecast price.
- Results depend on the selected source, moving-average methods, lengths, smoothing, lookbacks, and thresholds.
- Rank-based measurements are relative to a rolling window and can change as old observations leave that window.
- Frequent MACD/Signal crossings create shorter cross cycles and can make Peak Retention change quickly.
- Low-liquidity symbols, gaps, abrupt price changes, and very short timeframes can produce rapid state transitions.
- The open bar remains fluid until it closes.
- The script does not include position sizing, stop placement, targets, backtesting, or risk management.
Use the indicator as one transparent source of momentum context alongside independent price analysis and risk controls.
Note di rilascio
ATTRIBUTION AND TERMINOLOGY CORRECTIONThis update adds explicit attribution for the optional ATR-normalized display. The concept of volatility-normalizing MACD with ATR is credited to Alex Spiroglou and his 2022 paper "MACD-V: Volatility Normalised Momentum." Alex Spiroglou is acknowledged as the originator of MACD-V.
The user-facing setting has been renamed from "ATR Units" to "ATR-Normalized Display," and the source comments and input tooltip now state the conceptual origin. This script does not claim authorship of MACD-V and does not reproduce the paper's full MACD-V ranges, trend-regime filters, Momentum Lifecycle RoadMap, or associated trading techniques.
The script's separate additions remain the five-state raw Histogram phase model, adaptive noise deadband, equilibrium hysteresis, robust magnitude score, subdued-to-reactivated magnitude logic, cross-cycle peak retention, MACD path efficiency, context readout, visual layers, and confirmed-bar event handling.
No default analytical behavior or event logic was changed by this attribution update. Because the option label changed, users who previously selected "ATR Units" may need to reselect "ATR-Normalized Display" after applying the update.
Note di rilascio
ATTRIBUTION, CORRECTION, AND FUNCTION REMOVALFollowing feedback from Alex Spiroglou, originator of MACD-V and author of the 2022 paper "MACD-V: Volatility Normalised Momentum," this update takes a stronger corrective step than attribution alone.
The optional ATR-normalized MACD display has been removed in full. The current version no longer calculates or displays MACD divided by ATR and does not implement the MACD-V formula, MACD-V ranges, trend-regime filters, the Momentum Lifecycle RoadMap, or associated MACD-V techniques.
A correction and attribution notice has been added to the source comments to acknowledge Alex Spiroglou and document the removed feature. The remaining display modes are Raw MACD and Percent of Slow Average.
The script's separate raw-MACD state-analysis functions remain unchanged: five-state Histogram phase classification, adaptive noise deadband, equilibrium hysteresis, robust magnitude scoring, subdued-to-reactivated magnitude logic, cross-cycle peak retention, MACD path efficiency, context readout, visual layers, and confirmed-bar event handling.
Users who previously selected the removed ATR-normalized option should select either Raw MACD or Percent of Slow Average after applying this update.

Declinazione di responsabilità
Le informazioni e le pubblicazioni non sono intese come, e non costituiscono, consulenza o raccomandazioni finanziarie, di investimento, di trading o di altro tipo fornite o approvate da TradingView. Per ulteriori informazioni, consultare i Termini di utilizzo.
Declinazione di responsabilità
Le informazioni e le pubblicazioni non sono intese come, e non costituiscono, consulenza o raccomandazioni finanziarie, di investimento, di trading o di altro tipo fornite o approvate da TradingView. Per ulteriori informazioni, consultare i Termini di utilizzo.