OPEN-SOURCE SCRIPT
HTF Profile Projection | Rainbow Matrix
GENERAL OVERVIEW
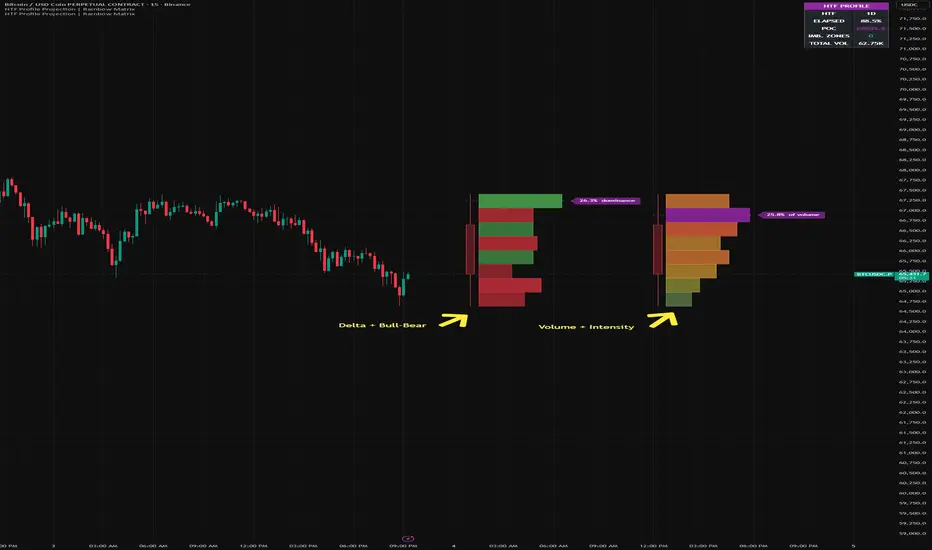
HTF Profile Projection is a live higher-timeframe X-ray. It takes the current, still-forming candle of a higher timeframe (for example the 4H or Daily candle) and projects it to the right of live price, then fills it with a horizontal profile that shows what is happening INSIDE that candle: where volume is concentrating, where buyers or sellers are dominating each price zone, and where price moved through empty space.
The goal is to let a trader read the internal structure of the higher-timeframe candle without leaving the current chart. Instead of seeing the 4H candle as a single block, you see its anatomy — the price levels that hold the most activity, the zones controlled by buyers versus sellers, and the thin gaps the candle ran through quickly. Every bar in the profile is built from real chart-bar data accumulated since the higher-timeframe candle opened, not drawn manually.
WHAT IS THE THEORY BEHIND THIS INDICATOR?
A higher-timeframe candle is a summary. A single 4H or Daily candle compresses hours of two-sided auction into one open, high, low, and close — and in doing so it hides where the volume actually traded and which side was in control at each price. Two candles with an identical body and identical range can have completely different internal structures: one built on heavy buying absorbed near the lows, the other on distribution near the highs. The standard candle cannot show that difference.
Most tools that try to surface this are built around the wrong constraint. Single-timeframe volume profiles describe the visible range, not the live higher-timeframe candle. Intrabar dissection tools that read true sub-candle data depend on functions that require additional data subscriptions and will not load on standard plans.
HTF Profile Projection takes a different route: it accumulates the chart's own bars since the higher-timeframe candle opened, and distributes each bar's activity across the price range it actually traversed. This reconstructs the internal volume and directional balance of the forming higher-timeframe candle using only standard data feeds — and projects it forward as a single, readable object.
The practical value: when price returns to a higher-timeframe candle later, the levels that mattered inside it — the high-volume node, the buyer- or seller-dominated zones, the empty imbalance gaps — are common revisit and reaction areas. Seeing them while the candle is still forming gives structural context that the candle body alone cannot.
HTF PROFILE PROJECTION FEATURES
The indicator includes these main components: a projected higher-timeframe candle, a range-spread movement profile, automatic resolution, a buy/sell dominance read, imbalance zones, a Point of Control marker, and a live info panel. Multilingual interface and full visual customization.
PROJECTED HTF CANDLE
🔹 What It Does
Reads the live, still-forming higher-timeframe candle and draws it (body + wicks) to the right of live price, color-coded by its direction. The horizontal profile attaches inside its price range.
🔹 Method
The higher-timeframe OHLCV is read via request.security() with lookahead=barmerge.lookahead_off, so no future information is used. The candle and its profile update in real time as the higher-timeframe bar forms — the intended live behavior — and reset cleanly when a new higher-timeframe period opens. If the chart timeframe is at or above the selected higher timeframe, the profile is hidden and a guard note is shown, because one chart bar covering the whole period cannot produce a meaningful internal read.
RANGE-SPREAD MOVEMENT PROFILE
🔹 What It Does
Splits the higher-timeframe candle's range into horizontal price buckets and fills each with the activity that occurred there.
🔹 Method
Since the higher-timeframe candle opened, each chart bar's volume and signed direction are accumulated, then distributed across every bucket the bar's low–high range spans — not dumped at a single midpoint. This range-spread approach makes both the per-zone volume and the per-zone buy/sell balance reflect where price actually traded inside the candle, rather than collapsing onto one level.
AUTOMATIC RESOLUTION
🔹 What It Does
The number of price buckets is chosen automatically from volatility. The higher-timeframe range is divided by the average chart-candle size (ATR), so each fraction of the profile corresponds to roughly one typical move of the chart timeframe.
🔹 Why It Matters
Calmer markets produce a finer profile; volatile markets produce a coarser one. The resolution matches the instrument and timeframe automatically, bounded between 4 and 50 buckets to keep the chart readable.
BUY/SELL DOMINANCE (DELTA MODE)
🔹 What It Does
In Delta mode (the default), each zone is colored by which side dominated: green for net buyers, red for net sellers, and gray for balanced zones where heavy two-way trade produced no clear winner. Bar length shows the magnitude of the imbalance.
🔹 Method
Each chart bar is classified by the sign of close versus open and contributes its volume as signed activity (+ for an up bar, − for a down bar). The net per zone is a direction-based proxy for buy/sell pressure, computed locally on standard data feeds — it is not exchange order-flow data, which Pine cannot access without additional subscriptions.
🔹 Volume Mode
Switching Source Metric to Volume colors the profile by a cold-to-hot intensity gradient instead, showing how much traded at each price regardless of direction.
IMBALANCE ZONES
🔹 What It Does
Price zones with little or no activity render distinctly. A contiguous run of empty buckets marks an imbalance — a price range the higher-timeframe candle moved through quickly with little participation.
🔹 Why It Matters
These gaps are not drawn as separate boxes; they emerge from the ABSENCE of activity in the profile. They are common revisit targets, since price often returns to fill ranges it previously skipped.
POINT OF CONTROL MARKER
🔹 What It Does
A horizontal marker tags the dominant bucket — the price level with the most activity (Volume mode) or the strongest net dominance (Delta mode). A label reports that level's share of the period's total.
LIVE INFO PANEL
🔹 What It Shows
A compact corner panel reports the higher timeframe in use, the percentage of the period elapsed, the Point of Control price, the number of imbalance zones, and the total higher-timeframe volume. When the chart-timeframe guard is active, the panel collapses to a single notice so the user always gets feedback.
🔹 Customization
The panel can be placed in any of the four chart corners and rendered in several font sizes. The display language is controlled by the System Language input.
[snapshot]
HOW TO USE
This indicator is not a signal generator. It is a structural X-ray: it shows the internal anatomy of the forming higher-timeframe candle.
🔹 Setup
Set the Higher Timeframe input above your current chart timeframe (for example chart 15m, HTF 4H). The forward candle appears to the right of live price. If the chart timeframe is at or above the HTF, the profile hides and the guard note appears.
🔹 Reading Delta Mode (default)
Green zones mark prices where buyers dominated, red where sellers dominated, gray where the auction was balanced. The Point of Control marks the most decisive level inside the candle.
🔹 Reading Volume Mode
The rainbow profile shows where the most volume traded. Long bars are high-activity nodes; gaps are low-volume imbalance zones.
🔹 Tactical Reading
◇ A high-activity node is a price the higher timeframe has accepted — a common reaction level on revisit.
◇ A buyer- or seller-dominated zone shows which side controlled that price during the period.
◇ An imbalance gap is a range price ran through quickly — a frequent magnet for later revisits.
INPUTS EXPLAINED
🔹 System Language
Display language for the panel and labels. Options: English (default), Português, Español, Русский, 中文 (Chinese).
🔹 Higher Timeframe
The higher timeframe to project. Must be above the chart timeframe.
🔹 Show Forward HTF Candle
Toggle for the projected candle body and wicks.
🔹 Auto-Resolution ATR Length
Lookback for the average chart-candle size used to pick the bucket count.
🔹 Source Metric
Volume (intensity gradient) or Delta (buy/sell dominance, default).
🔹 Projection Offset / Profile Width
Position and maximum horizontal length of the profile to the right of price.
🔹 Spike Threshold / Imbalance Threshold
Controls for what counts as a high-activity node and what counts as an empty/imbalance zone.
🔹 Palette Mode
Intensity (cold-to-hot) or Bull-Bear (dominance coloring, default).
🔹 Profile Transparency / Show POC Marker
Visual styling for the profile and the Point of Control line.
🔹 Info Panel / Position / Font Size
Toggle, corner, and size for the live panel.
IMPORTANT NOTES
HTF Profile Projection works on any chart timeframe below the selected higher timeframe. It is built for liquid instruments with reliable volume data: crypto perpetual contracts, large-cap equities, futures, major forex pairs. On low-volume instruments the profile becomes less reliable.
This is a real-time tool. The forming higher-timeframe candle and its profile update intra-period by design; the profile resets when a new higher-timeframe period opens. It uses only request.security() and chart-bar accumulation, so it runs on standard data feeds without footprint() or request.security_lower_tf().
Pine Script v6. Open-source under Mozilla Public License 2.0.
UNIQUENESS
HTF Profile Projection is unique in how it unifies three reads into one object. Most higher-timeframe context tools stack separate features: a candle outline, fair-value-gap rectangles, and volume-spike markers. This indicator merges them — the forward higher-timeframe candle and its volume-by-price profile are a single object. High-activity zones appear as the profile's longest bars; imbalance zones are not drawn at all, they emerge from the absence of activity in the profile. The buy/sell dominance read is reconstructed from chart-bar direction and distributed across each bar's true price range, so it reflects where the auction was actually contested — and it does this on standard data feeds, without the order-flow subscriptions that comparable intrabar tools require. The combination of a live forward-projected candle, automatic volatility-matched resolution, range-spread accumulation, and dominance-versus-balance coloring produces a structural read that behaves differently from single-timeframe volume profiles and from static fair-value-gap tools.
HTF Profile Projection is a live higher-timeframe X-ray. It takes the current, still-forming candle of a higher timeframe (for example the 4H or Daily candle) and projects it to the right of live price, then fills it with a horizontal profile that shows what is happening INSIDE that candle: where volume is concentrating, where buyers or sellers are dominating each price zone, and where price moved through empty space.
The goal is to let a trader read the internal structure of the higher-timeframe candle without leaving the current chart. Instead of seeing the 4H candle as a single block, you see its anatomy — the price levels that hold the most activity, the zones controlled by buyers versus sellers, and the thin gaps the candle ran through quickly. Every bar in the profile is built from real chart-bar data accumulated since the higher-timeframe candle opened, not drawn manually.
WHAT IS THE THEORY BEHIND THIS INDICATOR?
A higher-timeframe candle is a summary. A single 4H or Daily candle compresses hours of two-sided auction into one open, high, low, and close — and in doing so it hides where the volume actually traded and which side was in control at each price. Two candles with an identical body and identical range can have completely different internal structures: one built on heavy buying absorbed near the lows, the other on distribution near the highs. The standard candle cannot show that difference.
Most tools that try to surface this are built around the wrong constraint. Single-timeframe volume profiles describe the visible range, not the live higher-timeframe candle. Intrabar dissection tools that read true sub-candle data depend on functions that require additional data subscriptions and will not load on standard plans.
HTF Profile Projection takes a different route: it accumulates the chart's own bars since the higher-timeframe candle opened, and distributes each bar's activity across the price range it actually traversed. This reconstructs the internal volume and directional balance of the forming higher-timeframe candle using only standard data feeds — and projects it forward as a single, readable object.
The practical value: when price returns to a higher-timeframe candle later, the levels that mattered inside it — the high-volume node, the buyer- or seller-dominated zones, the empty imbalance gaps — are common revisit and reaction areas. Seeing them while the candle is still forming gives structural context that the candle body alone cannot.
HTF PROFILE PROJECTION FEATURES
The indicator includes these main components: a projected higher-timeframe candle, a range-spread movement profile, automatic resolution, a buy/sell dominance read, imbalance zones, a Point of Control marker, and a live info panel. Multilingual interface and full visual customization.
PROJECTED HTF CANDLE
🔹 What It Does
Reads the live, still-forming higher-timeframe candle and draws it (body + wicks) to the right of live price, color-coded by its direction. The horizontal profile attaches inside its price range.
🔹 Method
The higher-timeframe OHLCV is read via request.security() with lookahead=barmerge.lookahead_off, so no future information is used. The candle and its profile update in real time as the higher-timeframe bar forms — the intended live behavior — and reset cleanly when a new higher-timeframe period opens. If the chart timeframe is at or above the selected higher timeframe, the profile is hidden and a guard note is shown, because one chart bar covering the whole period cannot produce a meaningful internal read.
RANGE-SPREAD MOVEMENT PROFILE
🔹 What It Does
Splits the higher-timeframe candle's range into horizontal price buckets and fills each with the activity that occurred there.
🔹 Method
Since the higher-timeframe candle opened, each chart bar's volume and signed direction are accumulated, then distributed across every bucket the bar's low–high range spans — not dumped at a single midpoint. This range-spread approach makes both the per-zone volume and the per-zone buy/sell balance reflect where price actually traded inside the candle, rather than collapsing onto one level.
AUTOMATIC RESOLUTION
🔹 What It Does
The number of price buckets is chosen automatically from volatility. The higher-timeframe range is divided by the average chart-candle size (ATR), so each fraction of the profile corresponds to roughly one typical move of the chart timeframe.
🔹 Why It Matters
Calmer markets produce a finer profile; volatile markets produce a coarser one. The resolution matches the instrument and timeframe automatically, bounded between 4 and 50 buckets to keep the chart readable.
BUY/SELL DOMINANCE (DELTA MODE)
🔹 What It Does
In Delta mode (the default), each zone is colored by which side dominated: green for net buyers, red for net sellers, and gray for balanced zones where heavy two-way trade produced no clear winner. Bar length shows the magnitude of the imbalance.
🔹 Method
Each chart bar is classified by the sign of close versus open and contributes its volume as signed activity (+ for an up bar, − for a down bar). The net per zone is a direction-based proxy for buy/sell pressure, computed locally on standard data feeds — it is not exchange order-flow data, which Pine cannot access without additional subscriptions.
🔹 Volume Mode
Switching Source Metric to Volume colors the profile by a cold-to-hot intensity gradient instead, showing how much traded at each price regardless of direction.
IMBALANCE ZONES
🔹 What It Does
Price zones with little or no activity render distinctly. A contiguous run of empty buckets marks an imbalance — a price range the higher-timeframe candle moved through quickly with little participation.
🔹 Why It Matters
These gaps are not drawn as separate boxes; they emerge from the ABSENCE of activity in the profile. They are common revisit targets, since price often returns to fill ranges it previously skipped.
POINT OF CONTROL MARKER
🔹 What It Does
A horizontal marker tags the dominant bucket — the price level with the most activity (Volume mode) or the strongest net dominance (Delta mode). A label reports that level's share of the period's total.
LIVE INFO PANEL
🔹 What It Shows
A compact corner panel reports the higher timeframe in use, the percentage of the period elapsed, the Point of Control price, the number of imbalance zones, and the total higher-timeframe volume. When the chart-timeframe guard is active, the panel collapses to a single notice so the user always gets feedback.
🔹 Customization
The panel can be placed in any of the four chart corners and rendered in several font sizes. The display language is controlled by the System Language input.
[snapshot]
HOW TO USE
This indicator is not a signal generator. It is a structural X-ray: it shows the internal anatomy of the forming higher-timeframe candle.
🔹 Setup
Set the Higher Timeframe input above your current chart timeframe (for example chart 15m, HTF 4H). The forward candle appears to the right of live price. If the chart timeframe is at or above the HTF, the profile hides and the guard note appears.
🔹 Reading Delta Mode (default)
Green zones mark prices where buyers dominated, red where sellers dominated, gray where the auction was balanced. The Point of Control marks the most decisive level inside the candle.
🔹 Reading Volume Mode
The rainbow profile shows where the most volume traded. Long bars are high-activity nodes; gaps are low-volume imbalance zones.
🔹 Tactical Reading
◇ A high-activity node is a price the higher timeframe has accepted — a common reaction level on revisit.
◇ A buyer- or seller-dominated zone shows which side controlled that price during the period.
◇ An imbalance gap is a range price ran through quickly — a frequent magnet for later revisits.
INPUTS EXPLAINED
🔹 System Language
Display language for the panel and labels. Options: English (default), Português, Español, Русский, 中文 (Chinese).
🔹 Higher Timeframe
The higher timeframe to project. Must be above the chart timeframe.
🔹 Show Forward HTF Candle
Toggle for the projected candle body and wicks.
🔹 Auto-Resolution ATR Length
Lookback for the average chart-candle size used to pick the bucket count.
🔹 Source Metric
Volume (intensity gradient) or Delta (buy/sell dominance, default).
🔹 Projection Offset / Profile Width
Position and maximum horizontal length of the profile to the right of price.
🔹 Spike Threshold / Imbalance Threshold
Controls for what counts as a high-activity node and what counts as an empty/imbalance zone.
🔹 Palette Mode
Intensity (cold-to-hot) or Bull-Bear (dominance coloring, default).
🔹 Profile Transparency / Show POC Marker
Visual styling for the profile and the Point of Control line.
🔹 Info Panel / Position / Font Size
Toggle, corner, and size for the live panel.
IMPORTANT NOTES
HTF Profile Projection works on any chart timeframe below the selected higher timeframe. It is built for liquid instruments with reliable volume data: crypto perpetual contracts, large-cap equities, futures, major forex pairs. On low-volume instruments the profile becomes less reliable.
This is a real-time tool. The forming higher-timeframe candle and its profile update intra-period by design; the profile resets when a new higher-timeframe period opens. It uses only request.security() and chart-bar accumulation, so it runs on standard data feeds without footprint() or request.security_lower_tf().
Pine Script v6. Open-source under Mozilla Public License 2.0.
UNIQUENESS
HTF Profile Projection is unique in how it unifies three reads into one object. Most higher-timeframe context tools stack separate features: a candle outline, fair-value-gap rectangles, and volume-spike markers. This indicator merges them — the forward higher-timeframe candle and its volume-by-price profile are a single object. High-activity zones appear as the profile's longest bars; imbalance zones are not drawn at all, they emerge from the absence of activity in the profile. The buy/sell dominance read is reconstructed from chart-bar direction and distributed across each bar's true price range, so it reflects where the auction was actually contested — and it does this on standard data feeds, without the order-flow subscriptions that comparable intrabar tools require. The combination of a live forward-projected candle, automatic volatility-matched resolution, range-spread accumulation, and dominance-versus-balance coloring produces a structural read that behaves differently from single-timeframe volume profiles and from static fair-value-gap tools.
Script open-source
Nello spirito di TradingView, l'autore di questo script lo ha reso open source, in modo che i trader possano esaminarne e verificarne la funzionalità. Complimenti all'autore! Sebbene sia possibile utilizzarlo gratuitamente, ricordiamo che la ripubblicazione del codice è soggetta al nostro Regolamento.

Rainbow Matrix AI - Multi-timeframe institutional analysis tools.
rainbowmatrix.ai
rainbowmatrix.ai
Declinazione di responsabilità
Le informazioni e le pubblicazioni non sono intese come, e non costituiscono, consulenza o raccomandazioni finanziarie, di investimento, di trading o di altro tipo fornite o approvate da TradingView. Per ulteriori informazioni, consultare i Termini di utilizzo.
Script open-source
Nello spirito di TradingView, l'autore di questo script lo ha reso open source, in modo che i trader possano esaminarne e verificarne la funzionalità. Complimenti all'autore! Sebbene sia possibile utilizzarlo gratuitamente, ricordiamo che la ripubblicazione del codice è soggetta al nostro Regolamento.
Rainbow Matrix AI - Multi-timeframe institutional analysis tools.
rainbowmatrix.ai
rainbowmatrix.ai
Declinazione di responsabilità
Le informazioni e le pubblicazioni non sono intese come, e non costituiscono, consulenza o raccomandazioni finanziarie, di investimento, di trading o di altro tipo fornite o approvate da TradingView. Per ulteriori informazioni, consultare i Termini di utilizzo.