OPEN-SOURCE SCRIPT
Aggiornato HTF Candle Clusters - Multi-Timeframe PO3 Overlay
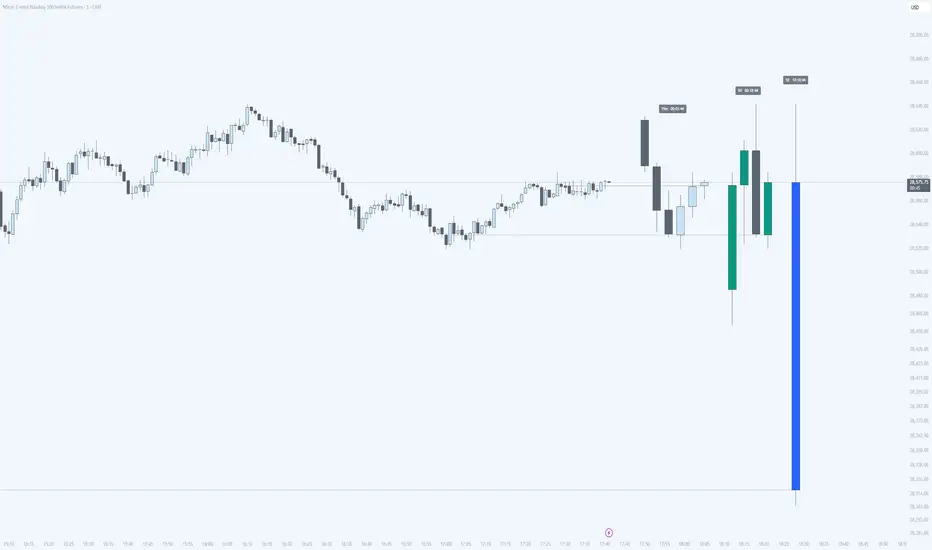
HTF Candle Clusters is a configurable multi-timeframe overlay that projects up to three higher-timeframe candle groups beside the live chart.
The indicator helps traders read higher-timeframe structure without leaving their execution timeframe. It provides a compact visual framework for HTF candle analysis, PO3 candle analysis, and discretionary Power of Three workflows.
KEY FEATURES
- Display up to three independent HTF candle clusters.
- Configure the timeframe and number of candles for each cluster.
- Use manual timeframes or enable Auto Mode to select suitable higher timeframes from the current chart timeframe.
- View the developing current HTF candle alongside completed HTF candles.
- Draw the current HTF open from its actual opening time to the projected current candle.
- Display the previous HTF candle midpoint when enabled.
- Show a live countdown for the current candle in each cluster.
- Combine the timeframe and countdown in a clean label positioned above the highest candle in the cluster.
- Customize bullish and bearish bodies, wicks, borders, open lines, midpoint lines, widths, colors, and line styles.
- Adjust candle width, candle spacing, cluster spacing, and right-side offset.
DEFAULT CONFIGURATION
- Auto Mode: enabled.
- Cluster 1: 15-minute timeframe, 6 candles.
- Cluster 2: 1-hour timeframe, 4 candles.
- Cluster 3: 1-day timeframe, 1 candle.
- Current HTF open lines: enabled with dotted style.
- Previous HTF midpoint lines: disabled by default and available per cluster.
- Countdown labels: enabled.
PO3 AND POWER OF THREE USE
PO3 traders can use the projected HTF candles to monitor the current higher-timeframe open, candle range, optional previous midpoint, and time remaining before the candle closes.
This indicator does not automatically classify accumulation, manipulation, or distribution, and it does not generate PO3 trading signals. It is a visual analysis tool designed to support discretionary PO3 candle and Power of Three analysis.
HOW TO USE
Apply the indicator to a timeframe lower than the configured cluster timeframes. Use the current HTF open and optional previous midpoint as visual reference levels while comparing the developing candle with recently completed higher-timeframe candles.
Each cluster can be enabled, disabled, or styled independently. Auto Mode is useful when moving between chart timeframes, while Manual Mode provides full control over the displayed HTFs.
NOTES
The current HTF candle updates as new market data arrives and remains developing until its timeframe closes. Completed HTF candles remain fixed.
The indicator is intended for time-based charts. A cluster must use a timeframe higher than the current chart timeframe.
ORIGINALITY
Unlike single-timeframe HTF candle overlays, this script focuses on side-by-side comparison of up to three independently configurable candle clusters. It combines custom candle counts, Auto Mode, actual HTF open anchoring, optional previous-candle midpoint levels, live countdowns, and per-cluster styling in one overlay.
This indicator is a visualization and educational tool. It does not provide financial advice, trade recommendations, or guaranteed outcomes.
The indicator helps traders read higher-timeframe structure without leaving their execution timeframe. It provides a compact visual framework for HTF candle analysis, PO3 candle analysis, and discretionary Power of Three workflows.
KEY FEATURES
- Display up to three independent HTF candle clusters.
- Configure the timeframe and number of candles for each cluster.
- Use manual timeframes or enable Auto Mode to select suitable higher timeframes from the current chart timeframe.
- View the developing current HTF candle alongside completed HTF candles.
- Draw the current HTF open from its actual opening time to the projected current candle.
- Display the previous HTF candle midpoint when enabled.
- Show a live countdown for the current candle in each cluster.
- Combine the timeframe and countdown in a clean label positioned above the highest candle in the cluster.
- Customize bullish and bearish bodies, wicks, borders, open lines, midpoint lines, widths, colors, and line styles.
- Adjust candle width, candle spacing, cluster spacing, and right-side offset.
DEFAULT CONFIGURATION
- Auto Mode: enabled.
- Cluster 1: 15-minute timeframe, 6 candles.
- Cluster 2: 1-hour timeframe, 4 candles.
- Cluster 3: 1-day timeframe, 1 candle.
- Current HTF open lines: enabled with dotted style.
- Previous HTF midpoint lines: disabled by default and available per cluster.
- Countdown labels: enabled.
PO3 AND POWER OF THREE USE
PO3 traders can use the projected HTF candles to monitor the current higher-timeframe open, candle range, optional previous midpoint, and time remaining before the candle closes.
This indicator does not automatically classify accumulation, manipulation, or distribution, and it does not generate PO3 trading signals. It is a visual analysis tool designed to support discretionary PO3 candle and Power of Three analysis.
HOW TO USE
Apply the indicator to a timeframe lower than the configured cluster timeframes. Use the current HTF open and optional previous midpoint as visual reference levels while comparing the developing candle with recently completed higher-timeframe candles.
Each cluster can be enabled, disabled, or styled independently. Auto Mode is useful when moving between chart timeframes, while Manual Mode provides full control over the displayed HTFs.
NOTES
The current HTF candle updates as new market data arrives and remains developing until its timeframe closes. Completed HTF candles remain fixed.
The indicator is intended for time-based charts. A cluster must use a timeframe higher than the current chart timeframe.
ORIGINALITY
Unlike single-timeframe HTF candle overlays, this script focuses on side-by-side comparison of up to three independently configurable candle clusters. It combines custom candle counts, Auto Mode, actual HTF open anchoring, optional previous-candle midpoint levels, live countdowns, and per-cluster styling in one overlay.
This indicator is a visualization and educational tool. It does not provide financial advice, trade recommendations, or guaranteed outcomes.
Note di rilascio
Fixed countdown timers in Bar Replay. The countdown now follows the active higher-timeframe close and advances with replay bars, while retaining wall-clock precision on live charts. Candle construction, cluster layout, and other indicators are unchanged.Script open-source
Nello spirito di TradingView, l'autore di questo script lo ha reso open source, in modo che i trader possano esaminarne e verificarne la funzionalità. Complimenti all'autore! Sebbene sia possibile utilizzarlo gratuitamente, ricordiamo che la ripubblicazione del codice è soggetta al nostro Regolamento.

Declinazione di responsabilità
Le informazioni e le pubblicazioni non sono intese come, e non costituiscono, consulenza o raccomandazioni finanziarie, di investimento, di trading o di altro tipo fornite o approvate da TradingView. Per ulteriori informazioni, consultare i Termini di utilizzo.
Script open-source
Nello spirito di TradingView, l'autore di questo script lo ha reso open source, in modo che i trader possano esaminarne e verificarne la funzionalità. Complimenti all'autore! Sebbene sia possibile utilizzarlo gratuitamente, ricordiamo che la ripubblicazione del codice è soggetta al nostro Regolamento.
Declinazione di responsabilità
Le informazioni e le pubblicazioni non sono intese come, e non costituiscono, consulenza o raccomandazioni finanziarie, di investimento, di trading o di altro tipo fornite o approvate da TradingView. Per ulteriori informazioni, consultare i Termini di utilizzo.