DCR/WCR Indicator with SPY Relative Strength
Overview
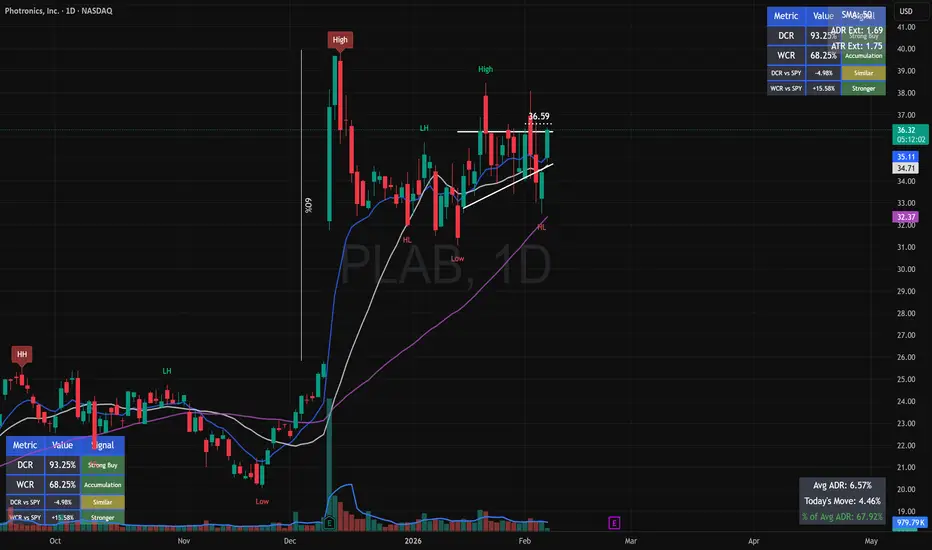
This indicator displays Daily Close Range (DCR) and Weekly Close Range (WCR) metrics to help traders identify momentum, buying/selling pressure, and relative strength compared to the S&P 500 (SPY). The data is presented in a clean, color-coded table that can be positioned anywhere on your chart.
What This Indicator Measures
Daily Close Range (DCR)
Formula: (Close - Low) / (High - Low) × 100
Purpose: Shows where the current candle closed within its daily range as a percentage (0-100%)
Interpretation:
90-100% (Strong Buy): Price closed near the daily high, indicating strong buying pressure and bullish momentum
70-90% (Bullish): Price closed in the upper portion of the range, suggesting buyers are in control
30-70% (Neutral): Price closed near the middle, indicating consolidation or indecision
10-30% (Bearish): Price closed in the lower portion, suggesting sellers are gaining control
0-10% (Strong Sell): Price closed near the daily low, indicating strong selling pressure and bearish momentum
Weekly Close Range (WCR)
Formula: (Weekly Close - Weekly Low) / (Weekly High - Weekly Low) × 100
Purpose: Analyzes where the stock finished the week relative to the weekly high and low
Interpretation:
≥60% (Accumulation): Closing in the top 40% of the weekly range suggests institutional buying and strong support. This often indicates smart money is entering positions
40-60% (Neutral): Middle of the range shows indecision with neither buyers nor sellers in clear control
≤40% (Distribution): Closing in the bottom 60% suggests selling pressure and potential institutional distribution
SPY Relative Strength Comparison
The indicator calculates the difference between your stock's DCR/WCR and SPY's DCR/WCR to determine relative strength:
Much Stronger (+20% or more): Your stock is significantly outperforming the market - exceptional relative strength
Stronger (+10% to +20%): Your stock is outperforming the market
Similar (-10% to +10%): Your stock is moving in line with the broader market
Weaker (-10% to -20%): Your stock is underperforming the market
Much Weaker (-20% or less): Your stock is significantly underperforming - consider this a warning sign
Trading Use Cases
Confirming Breakouts
High DCR (>70%) during a breakout confirms strong buying interest
High WCR (>60%) suggests institutional support for the move
If both are strong while SPY is weak, you've identified exceptional relative strength
Identifying Reversals
Extremely low DCR (<10%) after a downtrend may signal capitulation
Rising DCR while WCR remains strong suggests a bounce is sustainable
Divergence between DCR and SPY can highlight emerging leadership
Volume Confirmation
High WCR (>60%) with strong volume = institutional accumulation (bullish)
Low WCR (<40%) with high volume = institutional distribution (bearish)
Use in conjunction with volume analysis for best results
Market Context
Compare your stock's metrics to SPY to understand if momentum is stock-specific or market-wide
Stocks showing strength while SPY is weak often become market leaders
Stocks showing weakness while SPY is strong should be avoided or exited
Customization Options
Table Position: Choose from 9 positions to place the table anywhere on your chart (top/middle/bottom × left/center/right)
SPY Comparison Toggle: Enable or disable the SPY relative strength comparison rows
Best Practices
Use Multiple Timeframes: DCR gives you intraday momentum, WCR provides the weekly trend
Combine with Volume: High WCR with strong volume is particularly bullish
Monitor Divergences: When DCR and WCR diverge, it may signal a change in trend
Relative Strength Matters: Focus on stocks showing strength vs SPY for better risk/reward
Context is Key: A high DCR in a downtrend may just be a bounce; always consider the bigger picture
Color Coding
The indicator uses intuitive color coding:
Green: Bullish signals (high DCR/WCR, outperformance vs SPY)
Yellow: Neutral signals (middle range, similar to SPY)
Red: Bearish signals (low DCR/WCR, underperformance vs SPY)
Note: This indicator works on all timeframes and asset types. It's particularly useful for swing traders and investors looking to identify momentum and institutional activity. Always use in conjunction with other technical analysis tools and proper risk management.
This indicator displays Daily Close Range (DCR) and Weekly Close Range (WCR) metrics to help traders identify momentum, buying/selling pressure, and relative strength compared to the S&P 500 (SPY). The data is presented in a clean, color-coded table that can be positioned anywhere on your chart.
What This Indicator Measures
Daily Close Range (DCR)
Formula: (Close - Low) / (High - Low) × 100
Purpose: Shows where the current candle closed within its daily range as a percentage (0-100%)
Interpretation:
90-100% (Strong Buy): Price closed near the daily high, indicating strong buying pressure and bullish momentum
70-90% (Bullish): Price closed in the upper portion of the range, suggesting buyers are in control
30-70% (Neutral): Price closed near the middle, indicating consolidation or indecision
10-30% (Bearish): Price closed in the lower portion, suggesting sellers are gaining control
0-10% (Strong Sell): Price closed near the daily low, indicating strong selling pressure and bearish momentum
Weekly Close Range (WCR)
Formula: (Weekly Close - Weekly Low) / (Weekly High - Weekly Low) × 100
Purpose: Analyzes where the stock finished the week relative to the weekly high and low
Interpretation:
≥60% (Accumulation): Closing in the top 40% of the weekly range suggests institutional buying and strong support. This often indicates smart money is entering positions
40-60% (Neutral): Middle of the range shows indecision with neither buyers nor sellers in clear control
≤40% (Distribution): Closing in the bottom 60% suggests selling pressure and potential institutional distribution
SPY Relative Strength Comparison
The indicator calculates the difference between your stock's DCR/WCR and SPY's DCR/WCR to determine relative strength:
Much Stronger (+20% or more): Your stock is significantly outperforming the market - exceptional relative strength
Stronger (+10% to +20%): Your stock is outperforming the market
Similar (-10% to +10%): Your stock is moving in line with the broader market
Weaker (-10% to -20%): Your stock is underperforming the market
Much Weaker (-20% or less): Your stock is significantly underperforming - consider this a warning sign
Trading Use Cases
Confirming Breakouts
High DCR (>70%) during a breakout confirms strong buying interest
High WCR (>60%) suggests institutional support for the move
If both are strong while SPY is weak, you've identified exceptional relative strength
Identifying Reversals
Extremely low DCR (<10%) after a downtrend may signal capitulation
Rising DCR while WCR remains strong suggests a bounce is sustainable
Divergence between DCR and SPY can highlight emerging leadership
Volume Confirmation
High WCR (>60%) with strong volume = institutional accumulation (bullish)
Low WCR (<40%) with high volume = institutional distribution (bearish)
Use in conjunction with volume analysis for best results
Market Context
Compare your stock's metrics to SPY to understand if momentum is stock-specific or market-wide
Stocks showing strength while SPY is weak often become market leaders
Stocks showing weakness while SPY is strong should be avoided or exited
Customization Options
Table Position: Choose from 9 positions to place the table anywhere on your chart (top/middle/bottom × left/center/right)
SPY Comparison Toggle: Enable or disable the SPY relative strength comparison rows
Best Practices
Use Multiple Timeframes: DCR gives you intraday momentum, WCR provides the weekly trend
Combine with Volume: High WCR with strong volume is particularly bullish
Monitor Divergences: When DCR and WCR diverge, it may signal a change in trend
Relative Strength Matters: Focus on stocks showing strength vs SPY for better risk/reward
Context is Key: A high DCR in a downtrend may just be a bounce; always consider the bigger picture
Color Coding
The indicator uses intuitive color coding:
Green: Bullish signals (high DCR/WCR, outperformance vs SPY)
Yellow: Neutral signals (middle range, similar to SPY)
Red: Bearish signals (low DCR/WCR, underperformance vs SPY)
Note: This indicator works on all timeframes and asset types. It's particularly useful for swing traders and investors looking to identify momentum and institutional activity. Always use in conjunction with other technical analysis tools and proper risk management.

Declinazione di responsabilità
Le informazioni e le pubblicazioni non sono intese come, e non costituiscono, consulenza o raccomandazioni finanziarie, di investimento, di trading o di altro tipo fornite o approvate da TradingView. Per ulteriori informazioni, consultare i Termini di utilizzo.
Declinazione di responsabilità
Le informazioni e le pubblicazioni non sono intese come, e non costituiscono, consulenza o raccomandazioni finanziarie, di investimento, di trading o di altro tipo fornite o approvate da TradingView. Per ulteriori informazioni, consultare i Termini di utilizzo.