OPEN-SOURCE SCRIPT
Aggiornato Andean Oscillator Pro

Full credit to alexgrover for the Andean Oscillator, which this is built on.
Original script: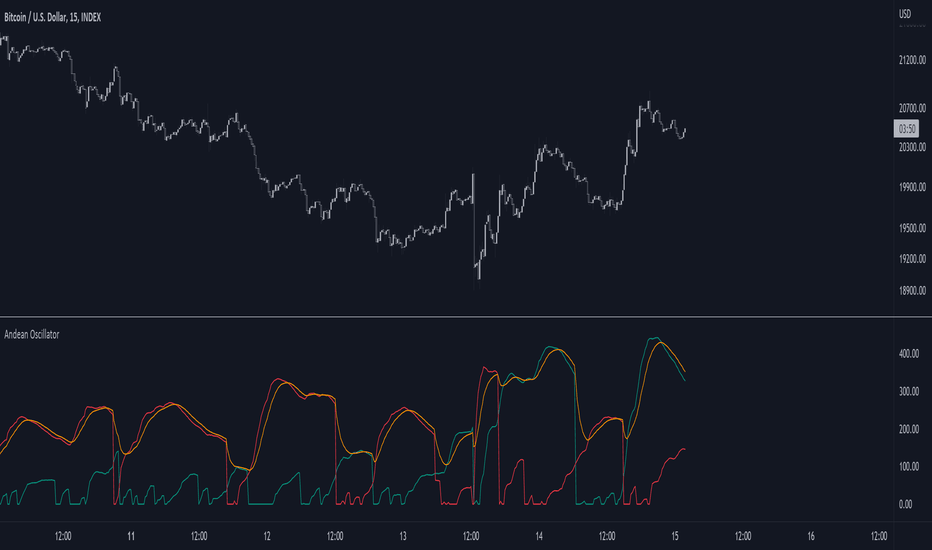
Original writeup: alpaca.markets/learn/andean-oscillator-a-new-technical-indicator-based-on-an-online-algorithm-for-trend-analysis/
WHAT THE ORIGINAL MEASURES
The oscillator tracks two exponential envelopes, one on price and one on price
squared. Differencing them recovers a standard deviation for each direction of
travel. The bull component grows as price pulls away above its lower envelope. The
bear component grows as price pulls away below its upper envelope. Whichever is
larger tells you which side is doing the work, and how hard.
The important thing to understand about this family of readings is that it is a
measure of distance already travelled. It cannot be large until a move has already
happened. That shapes everything about how you use it.
WHAT THIS VERSION ADDS
Adaptive envelope decay. The original decays its envelopes at a fixed rate set by one
length input. This version computes an efficiency ratio over a lookback and slides the
decay rate between a fast bound and a slow bound. In a clean directional move the
envelope forgets old extremes quickly, so the reading responds sooner. In chop it
slows back down to roughly the original behaviour. ER Power controls how much trend
quality it demands before speeding up.
Normalization. The raw components come out in price units, which means a threshold you
find on one symbol is meaningless on another. Percent mode expresses them as a share of
price. ATR mode expresses them in volatility units. Either way your settings travel.
Energy gate. The original compares the components to their own moving average, which
costs you several bars of lag. This version ranks the larger component as a percentile
of its own recent history instead. There is no smoothing involved, so it reacts the
moment expansion starts, and the number means the same thing on every instrument. A
gate of 90 means you only act on readings in the top tenth of what this market
normally produces.
Deadband with hysteresis. Entry requires the spread between the two components to
clear a percentile band. Exit only requires the spread to change sign. That asymmetry
is what lets the faster envelope run without producing constant flips around the zero
line.
Trade management on the chart. When bias flips, the script marks the entry and places
a stop at a multiple of ATR, both drawn on the price chart. Once price has moved a set
distance in your favour the stop jumps to just past your cost, then a chandelier trail
arms and ratchets in one direction only. It never loosens. The trade ends at that stop
or on an opposite signal, which closes and reverses. Stop colour tells you the state
at a glance. Red is the initial stop, orange means breakeven is locked, blue means the
trail is running.
Everything else. Optional squeeze filter requiring a quiet stretch before the gate
opens, the envelopes drawn on the price chart, bias shown three ways so you can read
direction without looking at numbers, and a single alert carrying entry, stop and
energy.
HOW TO READ IT
Green bars, green background, LONG label means the bull component leads and the gate
was open when it flipped. Red is the reverse. Grey bars mean no position. The two
faint black lines in the pane are the deadband, so you can see how far the spread has
to travel before a flip qualifies. Fill intensity between the components tracks
energy, so a washed out fill means the market is quiet by its own standards even if
the components have crossed.
Orange dots along the bottom mark bars where the gate is open but no bias has been
established yet. Think of those as armed and waiting.
SETTINGS
Energy Gate is the one that matters. It sets how selective the entries are, and
nothing else in the script changes behaviour as much. Raise it for fewer and larger
setups, lower it for more frequent ones. Expect a high gate to feel quiet. That is the
setting working.
Stop, breakeven and trail distances are all measured in ATR rather than in R, and that
is deliberate. Denominating protection distance in R ties how far you wait before
protecting profit to how far you are willing to be wrong, and those two should move
independently.
Defaults are set for 15 minute crypto. Presets are included for 5 minute and 1 hour.
Published open source under CC BY-NC-SA 4.0, same license as the original.
Original script:
Original writeup: alpaca.markets/learn/andean-oscillator-a-new-technical-indicator-based-on-an-online-algorithm-for-trend-analysis/
WHAT THE ORIGINAL MEASURES
The oscillator tracks two exponential envelopes, one on price and one on price
squared. Differencing them recovers a standard deviation for each direction of
travel. The bull component grows as price pulls away above its lower envelope. The
bear component grows as price pulls away below its upper envelope. Whichever is
larger tells you which side is doing the work, and how hard.
The important thing to understand about this family of readings is that it is a
measure of distance already travelled. It cannot be large until a move has already
happened. That shapes everything about how you use it.
WHAT THIS VERSION ADDS
Adaptive envelope decay. The original decays its envelopes at a fixed rate set by one
length input. This version computes an efficiency ratio over a lookback and slides the
decay rate between a fast bound and a slow bound. In a clean directional move the
envelope forgets old extremes quickly, so the reading responds sooner. In chop it
slows back down to roughly the original behaviour. ER Power controls how much trend
quality it demands before speeding up.
Normalization. The raw components come out in price units, which means a threshold you
find on one symbol is meaningless on another. Percent mode expresses them as a share of
price. ATR mode expresses them in volatility units. Either way your settings travel.
Energy gate. The original compares the components to their own moving average, which
costs you several bars of lag. This version ranks the larger component as a percentile
of its own recent history instead. There is no smoothing involved, so it reacts the
moment expansion starts, and the number means the same thing on every instrument. A
gate of 90 means you only act on readings in the top tenth of what this market
normally produces.
Deadband with hysteresis. Entry requires the spread between the two components to
clear a percentile band. Exit only requires the spread to change sign. That asymmetry
is what lets the faster envelope run without producing constant flips around the zero
line.
Trade management on the chart. When bias flips, the script marks the entry and places
a stop at a multiple of ATR, both drawn on the price chart. Once price has moved a set
distance in your favour the stop jumps to just past your cost, then a chandelier trail
arms and ratchets in one direction only. It never loosens. The trade ends at that stop
or on an opposite signal, which closes and reverses. Stop colour tells you the state
at a glance. Red is the initial stop, orange means breakeven is locked, blue means the
trail is running.
Everything else. Optional squeeze filter requiring a quiet stretch before the gate
opens, the envelopes drawn on the price chart, bias shown three ways so you can read
direction without looking at numbers, and a single alert carrying entry, stop and
energy.
HOW TO READ IT
Green bars, green background, LONG label means the bull component leads and the gate
was open when it flipped. Red is the reverse. Grey bars mean no position. The two
faint black lines in the pane are the deadband, so you can see how far the spread has
to travel before a flip qualifies. Fill intensity between the components tracks
energy, so a washed out fill means the market is quiet by its own standards even if
the components have crossed.
Orange dots along the bottom mark bars where the gate is open but no bias has been
established yet. Think of those as armed and waiting.
SETTINGS
Energy Gate is the one that matters. It sets how selective the entries are, and
nothing else in the script changes behaviour as much. Raise it for fewer and larger
setups, lower it for more frequent ones. Expect a high gate to feel quiet. That is the
setting working.
Stop, breakeven and trail distances are all measured in ATR rather than in R, and that
is deliberate. Denominating protection distance in R ties how far you wait before
protecting profit to how far you are willing to be wrong, and those two should move
independently.
Defaults are set for 15 minute crypto. Presets are included for 5 minute and 1 hour.
Published open source under CC BY-NC-SA 4.0, same license as the original.
Note di rilascio
Fixed a novel bug and a graphical one. Stops should plot on the chart in the correct location now.Script open-source
Nello spirito di TradingView, l'autore di questo script lo ha reso open source, in modo che i trader possano esaminarne e verificarne la funzionalità. Complimenti all'autore! Sebbene sia possibile utilizzarlo gratuitamente, ricordiamo che la ripubblicazione del codice è soggetta al nostro Regolamento.

Don't force a trade. Wait for your setup, be patient. Trade ideas are my own and not financial advice, I'm a monkey with a phone for crying out loud.
Declinazione di responsabilità
Le informazioni e le pubblicazioni non sono intese come, e non costituiscono, consulenza o raccomandazioni finanziarie, di investimento, di trading o di altro tipo fornite o approvate da TradingView. Per ulteriori informazioni, consultare i Termini di utilizzo.
Script open-source
Nello spirito di TradingView, l'autore di questo script lo ha reso open source, in modo che i trader possano esaminarne e verificarne la funzionalità. Complimenti all'autore! Sebbene sia possibile utilizzarlo gratuitamente, ricordiamo che la ripubblicazione del codice è soggetta al nostro Regolamento.
Don't force a trade. Wait for your setup, be patient. Trade ideas are my own and not financial advice, I'm a monkey with a phone for crying out loud.
Declinazione di responsabilità
Le informazioni e le pubblicazioni non sono intese come, e non costituiscono, consulenza o raccomandazioni finanziarie, di investimento, di trading o di altro tipo fornite o approvate da TradingView. Per ulteriori informazioni, consultare i Termini di utilizzo.