OPEN-SOURCE SCRIPT
Parallel Transport & Holonomy [DAFE]
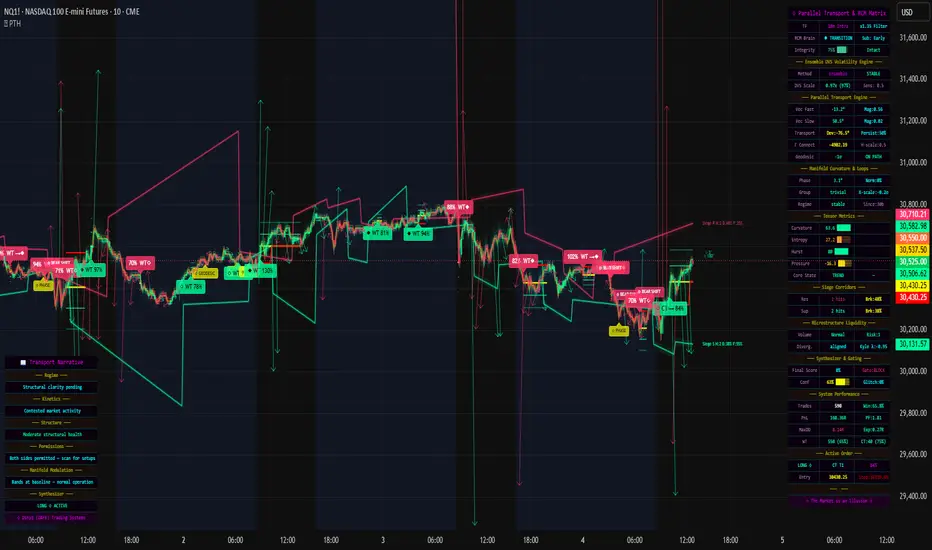
Parallel Transport & Holonomy [DAFE] - (⟡ PTH)
This publication presents the quantitative mechanics and theoretical architecture behind the Parallel Transport & Holonomy [DAFE] engine. This system models price and volume dynamics as trajectories on a continuous two-dimensional manifold. By computing the parallel transport of multi-scale momentum vectors, tracking their covariant derivatives, and integrating their path-dependent rotational deficit (Holonomy), the indicator identifies macro regime shifts, structural pivots, and trend continuations.
The architecture is entirely self-contained, featuring a Legit Footprint Toggle that automatically falls back to an advanced Synthetic Footprint Engine when tick-level footprint data is unavailable. It is strictly anchored by a Rolling Confidence Matrix (RCM) and modulated by an Ensemble Dynamic Volatility Scaling (DVS) engine.
The core principle of this system is geometric invariance: signal evaluation is not based on static, lagging thresholds but on the coordinate-invariant deviation of momentum from its natural geodesic path.
━━━━━━━━━━━━━━━━━━━━━━━━━━━━━━━━━━
Riemannian Price-Volume Manifold & Metric Tensor
━━━━━━━━━━━━━━━━━━━━━━━━━━━━━━━━━━
We define the market state as a coordinate point on a two-dimensional Riemannian manifold
M, where the coordinates are:

━━━━━━━━━━━━━━━━━━━━━━━━━━━━━━━━━━
Parallel Transport & Covariant Derivatives
━━━━━━━━━━━━━━━━━━━━━━━━━━━━━━━━━━
Let V be a momentum vector on the tangent space of the manifold, constructed at three distinct temporal scales: Fast (vecFast), Medium (vecMed), and Slow (vecSlow). The coordinate components of the vector scale k are computed as:

Geodesic Deviation
A path is geodesic if its covariant derivative along the direction of travel is zero (representing the path of least resistance on the manifold). We define the geodesic deviation Zgeodesic as the rolling z-score of the absolute transport deviation:

━━━━━━━━━━━━━━━━━━━━━━━━━━━━━━━━━━
Holonomy & Phase Accumulation
━━━━━━━━━━━━━━━━━━━━━━━━━━━━━━━━━━
Holonomy describes the geometric phenomenon where parallel transporting a vector along a closed loop returns a vector with a changed orientation. This angular deficit directly measures the total curvature enclosed by the loop.

Holonomy Group Classifications
Based on the magnitude of the accumulated rotation (HolonomyNorm), the local coordinate space is classified into four geometric groups:
Holonomy Regime Shifts
A Regime Shift is triggered when HolonomyNorm exceeds the user-defined threshold (i_holoThresh). Depending on the sign of the accumulated loop (sgn(H)) and the divergence between the fast and slow vectors, the engine classifies the transition into one of the following states:
━━━━━━━━━━━━━━━━━━━━━━━━━━━━━━━━━━
Rolling Confidence Matrix (RCM)
━━━━━━━━━━━━━━━━━━━━━━━━━━━━━━━━━━
The Rolling Confidence Matrix (RCM) acts as a structural anchor. It takes multi-scale geometric indicators from the transport engine and compiles them into a state-space model that dynamically controls signal permissions.
State Space Representation
The matrix maintains a rolling assessment of market structure across three distinct states:
External Evidence Injection
On every bar, the system injects external geometric parameters from the manifold:

This evidence is integrated into the RCM, outputting structural permissions (allowLong, allowShort) and score modulations that are applied to the final signal scoring calculations.
━━━━━━━━━━━━━━━━━━━━━━━━━━━━━━━━━━
Ensemble Dynamic Volatility Scaling (DVS)
━━━━━━━━━━━━━━━━━━━━━━━━━━━━━━━━━━
To adapt the mathematical models to varying market volatility, the script runs three independent volatility estimators concurrently on every bar:

Ensemble Combinatorics
The baseline values are calculated as moving averages over the memory period. The script then computes the ratios of the current estimators to their historical baselines:

This ratio dynamically scales the width of the holographic manifold bands and the RCM damage thresholds: during highly volatile regimes, thresholds are expanded to prevent whipsaws; during compression regimes, thresholds are tightened to capture early breakouts.
━━━━━━━━━━━━━━━━━━━━━━━━━━━━━━━━━━
Footprint & Synthetic Fallback Engine
━━━━━━━━━━━━━━━━━━━━━━━━━━━━━━━━━━
The script includes a Use Legit Footprint toggle (i_useFp). When enabled on charts supporting tick databases, the system requests official exchange-traded order flow data:
Pine Script®
The Advanced Synthetic Footprint Engine
If the user deactivates the footprint toggle, or if the asset/timeframe does not support tick database access (e.g., historical bars or Forex), the Synthetic Footprint Fallback Engine** takes over, simulating volume-at-price and directional delta using high-frequency mathematical approximations:

This estimated delta reconstructs the synthetic buy and sell pressures:

Kyle's Lambda (Price Impact & Liquidity Risk)
Using these directional volumes, we calculate Kyle's price impact coefficient λ, measuring the price change per unit of volume flow:

High values of λ represent illiquid, thin, or toxic conditions. The system calculates the z-score of lambda (Zλ). If Zλ > 2.0, signal scores are dynamically penalized to protect capital from low-liquidity slippage.
━━━━━━━━━━━━━━━━━━━━━━━━━━━━━━━━━━
Structural Scoring & Signal Gating
━━━━━━━━━━━━━━━━━━━━━━━━━━━━━━━━━━
The system generates a directional Signal Score using a two-tier quantitative scoring process.
Stage 1: Structural Base (Minimum of one required)
Siege Corridor Proximity: Price is within 1.2 ⋅ ATR of a verified support or resistance level.
ScoreBase = 0.28+(Hold Probability⋅0.18)
EMA21 Geodesic Pullback: Price pulls back to the EMA21 in trend alignment.
ScoreBase = 0.25
RSI Extreme Exhaustion: RSI is below 25 (for longs) or above 75 (for shorts).
ScoreBase = 0.28
Stage 2: Confirmations (Additive)
Multi-pattern confluence (2+ patterns matching): +0.15
Pressure bar strength exceeds thresholds: +0.08 to +0.15
Metric curvature aligns with structural turn: +0.10
Volume expansion exceeds historical average: +0.10
Holonomy phase shifts or loop spikes: +0.12
Directional Scaling & Gating
The score is adjusted based on trend alignment. With-Trend (WT) setups (longs above the EMA50, shorts below) are evaluated using standard thresholds. Counter-Trend (CT)setups face a strict scaling penalty:
ScoreCT = ScoreRaw ⋅ clamp(1.0−Trend Strength⋅0.15,0.45,1.0)
Additionally, the score passes through three gates:
━━━━━━━━━━━━━━━━━━━━━━━━━━━━━━━━━━
Input Reference
━━━━━━━━━━━━━━━━━━━━━━━━━━━━━━━━━━
═══ GEOMETRY ENGINE ═══
Hurst Period (30 to 200, default 80): Lookback window for R/S calculations to evaluate trend persistence.
Pivot Length (2 to 15, default 5): Lookback/lookahead buffer for swing pivot detection.
TF Preset (Auto, 1m-5m Scalp, 10m-15m Intra, 30m-1H Swing, 4H-D Position): Set the timeframe scaling preset. Auto dynamically scales lookbacks based on the current chart timeframe.
Use Legit Footprint (Boolean, default true): Toggles whether to query exchange tick database for real footprint data.
Footprint Ticks/Row (1 to 500, default 100): Height of the footprint rows in tick units.
Footprint VA % (50 to 90, default 70): Percentage of volume enclosed within the Value Area.
═══ TRANSPORT & HOLONOMY ═══
Vector Fast Scale (3 to 21, default 8): Periods for tracking short-term momentum vectors.
Vector Medium Scale (10 to 55, default 21): Periods for intermediate momentum geometry.
Vector Slow Scale (21 to 144, default 55): Baseline vector window representing the macro manifold.
Holonomy Window (13 to 89, default 34): Size of the temporal loop used to integrate local deviations.
Holonomy Spike Threshold (0.10 to 0.90, default 0.35): Sensitivity threshold for identifying rotational shifts.
Geodesic Deviation Sensitivity (0.5 to 3.0, default 1.5): Sensitivity for flagging off-path momentum.
Enable Continuation Signals (Boolean, default true): Toggles secondary pullback entries in strong trends.
═══ ROLLING CONFIDENCE MATRIX ═══
Block Transition Signals (Boolean, default true): If active, blocks standard entry signals when the matrix is in transition state.
Conf Band Tightening Factor (0.0 to 1.0, default 0.35): Compression multiplier for manifold bands under high confidence.
Damage Band Expansion (1.0 to 1.5, default 1.15): Expansion multiplier for manifold bands under structural damage.
═══ DYNAMIC VOLATILITY SCALING (DVS) ═══
Enable Ensemble DVS Engine (Boolean, default true): Toggles whether to scale target multiples and thresholds by volatility.
DVS Method (ATR Ratio, Parkinson, Garman-Klass, Ensemble): Method for calculating real-time volatility.
DVS Memory Period (20 to 200, default 100): Baseline lookback window for historical volatility.
DVS Sensitivity (0.3 to 1.5, default 0.7): Exponent scaling parameter for the DVS ratio.
═══ SIGNAL GATING ═══
Signal Threshold (0.10 to 0.85, default 0.40): Minimum score required to fire a signal.
Cooldown Bars (1 to 50, default 6): Minimum bar spacing between consecutive signals.
━━━━━━━━━━━━━━━━━━━━━━━━━━━━━━━━━━
Visual System & Dashboard Interpretation
━━━━━━━━━━━━━━━━━━━━━━━━━━━━━━━━━━
Transport Field Manifold: A multi-layered band surrounding price. It contracts during clean, high-confidence geodesic flow and expands during high-entropy, damaged, or volatile regimes. Its color is determined by the RCM state: Green for bullish stability, Red for bearish, and Purple during transitions.

Siege Corridors: Plotted as horizontal support (Green) and resistance (Red) zones with an ATR-scaled boundary. At the right-hand side of the chart, these corridors display critical metrics: the total historical hit count, the estimated break probability (Pbreak), and the fail/reversal probability (Pfail).

Vector Field Lines: Small arrow-headed lines plotted on every third bar. They show the mathematical direction of the Fast momentum vector. They visually represent the difference between the actual observed path of the market and the expected parallel-transported baseline.

Holonomy Phase Ring: An indicator plotted at the right edge of the chart displaying the current phase angle (e.g., ◐ 144∘).
Glitch Markers: Flagged on the chart as ◈ GLITCH when anomalous pricing data or sudden coordinate jumps are detected on the manifold.
Dashboard: Displays real-time metric readings from all quantitative modules:

━━━━━━━━━━━━━━━━━━━━━━━━━━━━━━━━━━
Limitations and Disclaimers
━━━━━━━━━━━━━━━━━━━━━━━━━━━━━━━━━━
This tool is for analytical purposes only and does not predict future market direction.
Historical Simulation: The built-in simulator represents hypothetical performance on historical data. Past results do not guarantee future performance.
Volume Approximations: The synthetic footprint engine uses OHLCV approximations to estimate volume-at-price and directional delta. It is not an actual connection to L2 exchange data feeds or a central clearing book.
Persistence: Reinforcement learning weights are state-space variables that exist within the local execution thread; they reset to 1.0 on every chart load or browser reload.
— Dskyz. Trade with insight. Trade with anticipation. (It's lonely at the top)
This publication presents the quantitative mechanics and theoretical architecture behind the Parallel Transport & Holonomy [DAFE] engine. This system models price and volume dynamics as trajectories on a continuous two-dimensional manifold. By computing the parallel transport of multi-scale momentum vectors, tracking their covariant derivatives, and integrating their path-dependent rotational deficit (Holonomy), the indicator identifies macro regime shifts, structural pivots, and trend continuations.
The architecture is entirely self-contained, featuring a Legit Footprint Toggle that automatically falls back to an advanced Synthetic Footprint Engine when tick-level footprint data is unavailable. It is strictly anchored by a Rolling Confidence Matrix (RCM) and modulated by an Ensemble Dynamic Volatility Scaling (DVS) engine.
The core principle of this system is geometric invariance: signal evaluation is not based on static, lagging thresholds but on the coordinate-invariant deviation of momentum from its natural geodesic path.
━━━━━━━━━━━━━━━━━━━━━━━━━━━━━━━━━━
Riemannian Price-Volume Manifold & Metric Tensor
━━━━━━━━━━━━━━━━━━━━━━━━━━━━━━━━━━
We define the market state as a coordinate point on a two-dimensional Riemannian manifold
M, where the coordinates are:
━━━━━━━━━━━━━━━━━━━━━━━━━━━━━━━━━━
Parallel Transport & Covariant Derivatives
━━━━━━━━━━━━━━━━━━━━━━━━━━━━━━━━━━
Let V be a momentum vector on the tangent space of the manifold, constructed at three distinct temporal scales: Fast (vecFast), Medium (vecMed), and Slow (vecSlow). The coordinate components of the vector scale k are computed as:
Geodesic Deviation
A path is geodesic if its covariant derivative along the direction of travel is zero (representing the path of least resistance on the manifold). We define the geodesic deviation Zgeodesic as the rolling z-score of the absolute transport deviation:
━━━━━━━━━━━━━━━━━━━━━━━━━━━━━━━━━━
Holonomy & Phase Accumulation
━━━━━━━━━━━━━━━━━━━━━━━━━━━━━━━━━━
Holonomy describes the geometric phenomenon where parallel transporting a vector along a closed loop returns a vector with a changed orientation. This angular deficit directly measures the total curvature enclosed by the loop.
Holonomy Group Classifications
Based on the magnitude of the accumulated rotation (HolonomyNorm), the local coordinate space is classified into four geometric groups:
- Trivial (Norm<0.10): The manifold is flat; parallel transport is path-independent, indicating quiet consolidated ranges.
- Abelian (Norm<0.25): Minor commutative drift; the vector field undergoes predictable linear shifts.
- Non-Abelian (Norm<0.50): Significant non-commutative curvature. Parallel transport is highly path-dependent, signaling complex trend development and institutional accumulation.
- Singular (Norm≥0.50): Severe rotational deficit. The manifold geometry has collapsed or rotated sharply, marking high-probability reversal peaks and structural transitions.
Holonomy Regime Shifts
A Regime Shift is triggered when HolonomyNorm exceeds the user-defined threshold (i_holoThresh). Depending on the sign of the accumulated loop (sgn(H)) and the divergence between the fast and slow vectors, the engine classifies the transition into one of the following states:
- Bull Rotation: Enclosed path yields a positive rotational deficit combined with positive multi-scale momentum.
- Bear Rotation: Enclosed path yields a negative rotational deficit combined with negative multi-scale momentum.
- Geodesic Break: Extreme localized acceleration causing the momentum field to tear away from its expected trajectory.
- Scale Divergence: High-frequency (fast) and low-frequency (slow) vectors rotate in opposite directions, enclosing a singular point.
━━━━━━━━━━━━━━━━━━━━━━━━━━━━━━━━━━
Rolling Confidence Matrix (RCM)
━━━━━━━━━━━━━━━━━━━━━━━━━━━━━━━━━━
The Rolling Confidence Matrix (RCM) acts as a structural anchor. It takes multi-scale geometric indicators from the transport engine and compiles them into a state-space model that dynamically controls signal permissions.
State Space Representation
The matrix maintains a rolling assessment of market structure across three distinct states:
- Established (State 0): The trend is structurally intact; manifold bands are compressed, and parallel transport confirms high directional persistence.
- Transition (State 1): Price is approaching key structural levels or experiencing a holonomy spike. Manifold bands widen, and standard signals are gated.
- Damaged (State 2): Price has broken through primary defensive corridors. Structural confidence is compromised; bands expand by the Damage Band Expansion multiplier
(i_damageWiden), and counter-trend positions are heavily penalized.
External Evidence Injection
On every bar, the system injects external geometric parameters from the manifold:
This evidence is integrated into the RCM, outputting structural permissions (allowLong, allowShort) and score modulations that are applied to the final signal scoring calculations.
━━━━━━━━━━━━━━━━━━━━━━━━━━━━━━━━━━
Ensemble Dynamic Volatility Scaling (DVS)
━━━━━━━━━━━━━━━━━━━━━━━━━━━━━━━━━━
To adapt the mathematical models to varying market volatility, the script runs three independent volatility estimators concurrently on every bar:
Ensemble Combinatorics
The baseline values are calculated as moving averages over the memory period. The script then computes the ratios of the current estimators to their historical baselines:
This ratio dynamically scales the width of the holographic manifold bands and the RCM damage thresholds: during highly volatile regimes, thresholds are expanded to prevent whipsaws; during compression regimes, thresholds are tightened to capture early breakouts.
━━━━━━━━━━━━━━━━━━━━━━━━━━━━━━━━━━
Footprint & Synthetic Fallback Engine
━━━━━━━━━━━━━━━━━━━━━━━━━━━━━━━━━━
The script includes a Use Legit Footprint toggle (i_useFp). When enabled on charts supporting tick databases, the system requests official exchange-traded order flow data:
The Advanced Synthetic Footprint Engine
If the user deactivates the footprint toggle, or if the asset/timeframe does not support tick database access (e.g., historical bars or Forex), the Synthetic Footprint Fallback Engine** takes over, simulating volume-at-price and directional delta using high-frequency mathematical approximations:
This estimated delta reconstructs the synthetic buy and sell pressures:
Kyle's Lambda (Price Impact & Liquidity Risk)
Using these directional volumes, we calculate Kyle's price impact coefficient λ, measuring the price change per unit of volume flow:
High values of λ represent illiquid, thin, or toxic conditions. The system calculates the z-score of lambda (Zλ). If Zλ > 2.0, signal scores are dynamically penalized to protect capital from low-liquidity slippage.
━━━━━━━━━━━━━━━━━━━━━━━━━━━━━━━━━━
Structural Scoring & Signal Gating
━━━━━━━━━━━━━━━━━━━━━━━━━━━━━━━━━━
The system generates a directional Signal Score using a two-tier quantitative scoring process.
Stage 1: Structural Base (Minimum of one required)
Siege Corridor Proximity: Price is within 1.2 ⋅ ATR of a verified support or resistance level.
ScoreBase = 0.28+(Hold Probability⋅0.18)
EMA21 Geodesic Pullback: Price pulls back to the EMA21 in trend alignment.
ScoreBase = 0.25
RSI Extreme Exhaustion: RSI is below 25 (for longs) or above 75 (for shorts).
ScoreBase = 0.28
Stage 2: Confirmations (Additive)
Multi-pattern confluence (2+ patterns matching): +0.15
Pressure bar strength exceeds thresholds: +0.08 to +0.15
Metric curvature aligns with structural turn: +0.10
Volume expansion exceeds historical average: +0.10
Holonomy phase shifts or loop spikes: +0.12
Directional Scaling & Gating
The score is adjusted based on trend alignment. With-Trend (WT) setups (longs above the EMA50, shorts below) are evaluated using standard thresholds. Counter-Trend (CT)setups face a strict scaling penalty:
ScoreCT = ScoreRaw ⋅ clamp(1.0−Trend Strength⋅0.15,0.45,1.0)
Additionally, the score passes through three gates:
- Liquidity Penalty: Reduced by up to 30% if order flow thickness is classified as Desert or Frozen.
- Kyle Lambda Gate: Penalized if price impact is highly volatile (Zλ > 2.0).
- Danger Gate: Score is multiplied by 0.60 if the composite risk danger index exceeds 75.
━━━━━━━━━━━━━━━━━━━━━━━━━━━━━━━━━━
Input Reference
━━━━━━━━━━━━━━━━━━━━━━━━━━━━━━━━━━
═══ GEOMETRY ENGINE ═══
Hurst Period (30 to 200, default 80): Lookback window for R/S calculations to evaluate trend persistence.
Pivot Length (2 to 15, default 5): Lookback/lookahead buffer for swing pivot detection.
TF Preset (Auto, 1m-5m Scalp, 10m-15m Intra, 30m-1H Swing, 4H-D Position): Set the timeframe scaling preset. Auto dynamically scales lookbacks based on the current chart timeframe.
Use Legit Footprint (Boolean, default true): Toggles whether to query exchange tick database for real footprint data.
Footprint Ticks/Row (1 to 500, default 100): Height of the footprint rows in tick units.
Footprint VA % (50 to 90, default 70): Percentage of volume enclosed within the Value Area.
═══ TRANSPORT & HOLONOMY ═══
Vector Fast Scale (3 to 21, default 8): Periods for tracking short-term momentum vectors.
Vector Medium Scale (10 to 55, default 21): Periods for intermediate momentum geometry.
Vector Slow Scale (21 to 144, default 55): Baseline vector window representing the macro manifold.
Holonomy Window (13 to 89, default 34): Size of the temporal loop used to integrate local deviations.
Holonomy Spike Threshold (0.10 to 0.90, default 0.35): Sensitivity threshold for identifying rotational shifts.
Geodesic Deviation Sensitivity (0.5 to 3.0, default 1.5): Sensitivity for flagging off-path momentum.
Enable Continuation Signals (Boolean, default true): Toggles secondary pullback entries in strong trends.
═══ ROLLING CONFIDENCE MATRIX ═══
Block Transition Signals (Boolean, default true): If active, blocks standard entry signals when the matrix is in transition state.
Conf Band Tightening Factor (0.0 to 1.0, default 0.35): Compression multiplier for manifold bands under high confidence.
Damage Band Expansion (1.0 to 1.5, default 1.15): Expansion multiplier for manifold bands under structural damage.
═══ DYNAMIC VOLATILITY SCALING (DVS) ═══
Enable Ensemble DVS Engine (Boolean, default true): Toggles whether to scale target multiples and thresholds by volatility.
DVS Method (ATR Ratio, Parkinson, Garman-Klass, Ensemble): Method for calculating real-time volatility.
DVS Memory Period (20 to 200, default 100): Baseline lookback window for historical volatility.
DVS Sensitivity (0.3 to 1.5, default 0.7): Exponent scaling parameter for the DVS ratio.
═══ SIGNAL GATING ═══
Signal Threshold (0.10 to 0.85, default 0.40): Minimum score required to fire a signal.
Cooldown Bars (1 to 50, default 6): Minimum bar spacing between consecutive signals.
━━━━━━━━━━━━━━━━━━━━━━━━━━━━━━━━━━
Visual System & Dashboard Interpretation
━━━━━━━━━━━━━━━━━━━━━━━━━━━━━━━━━━
Transport Field Manifold: A multi-layered band surrounding price. It contracts during clean, high-confidence geodesic flow and expands during high-entropy, damaged, or volatile regimes. Its color is determined by the RCM state: Green for bullish stability, Red for bearish, and Purple during transitions.
Siege Corridors: Plotted as horizontal support (Green) and resistance (Red) zones with an ATR-scaled boundary. At the right-hand side of the chart, these corridors display critical metrics: the total historical hit count, the estimated break probability (Pbreak), and the fail/reversal probability (Pfail).
Vector Field Lines: Small arrow-headed lines plotted on every third bar. They show the mathematical direction of the Fast momentum vector. They visually represent the difference between the actual observed path of the market and the expected parallel-transported baseline.
Holonomy Phase Ring: An indicator plotted at the right edge of the chart displaying the current phase angle (e.g., ◐ 144∘).
Glitch Markers: Flagged on the chart as ◈ GLITCH when anomalous pricing data or sudden coordinate jumps are detected on the manifold.
Dashboard: Displays real-time metric readings from all quantitative modules:
- Tensor Metrics: Curvature, Entropy, Hurst Exponent, and Price Pressure.
- Volatility: Dynamic DVS Ratio, active estimator method, and scaling state.
- RCM Brain: State classification, integrity index, and gate permissions.
- Performance: Total trades, win rate, total profit (R-multiple), profit factor, and max drawdown.
━━━━━━━━━━━━━━━━━━━━━━━━━━━━━━━━━━
Limitations and Disclaimers
━━━━━━━━━━━━━━━━━━━━━━━━━━━━━━━━━━
This tool is for analytical purposes only and does not predict future market direction.
Historical Simulation: The built-in simulator represents hypothetical performance on historical data. Past results do not guarantee future performance.
Volume Approximations: The synthetic footprint engine uses OHLCV approximations to estimate volume-at-price and directional delta. It is not an actual connection to L2 exchange data feeds or a central clearing book.
Persistence: Reinforcement learning weights are state-space variables that exist within the local execution thread; they reset to 1.0 on every chart load or browser reload.
— Dskyz. Trade with insight. Trade with anticipation. (It's lonely at the top)
Script open-source
Nello spirito di TradingView, l'autore di questo script lo ha reso open source, in modo che i trader possano esaminarne e verificarne la funzionalità. Complimenti all'autore! Sebbene sia possibile utilizzarlo gratuitamente, ricordiamo che la ripubblicazione del codice è soggetta al nostro Regolamento.

Declinazione di responsabilità
Le informazioni e le pubblicazioni non sono intese come, e non costituiscono, consulenza o raccomandazioni finanziarie, di investimento, di trading o di altro tipo fornite o approvate da TradingView. Per ulteriori informazioni, consultare i Termini di utilizzo.
Script open-source
Nello spirito di TradingView, l'autore di questo script lo ha reso open source, in modo che i trader possano esaminarne e verificarne la funzionalità. Complimenti all'autore! Sebbene sia possibile utilizzarlo gratuitamente, ricordiamo che la ripubblicazione del codice è soggetta al nostro Regolamento.
Declinazione di responsabilità
Le informazioni e le pubblicazioni non sono intese come, e non costituiscono, consulenza o raccomandazioni finanziarie, di investimento, di trading o di altro tipo fornite o approvate da TradingView. Per ulteriori informazioni, consultare i Termini di utilizzo.