OPEN-SOURCE SCRIPT
Oscillator Radar 3D [NeBlok]
OSCILLATOR RADAR 3D [NeBlok]
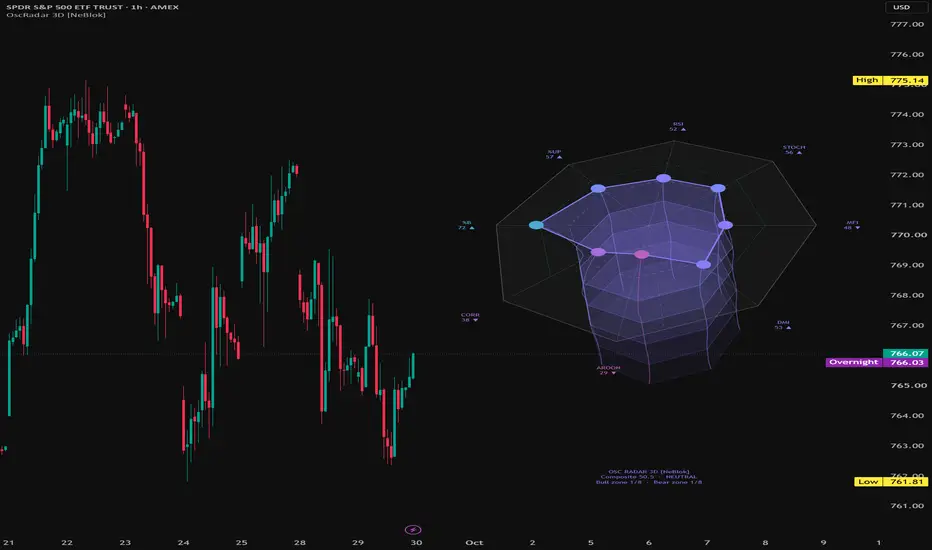
Eight different oscillators, one picture. This indicator normalizes eight oscillators to a common 0–100 scale and plots them as a radar (spider) chart to the right of your price action. A 3D engine tilts the radar and stacks past snapshots behind it, so you can see not only where momentum is now but how it got there.
──────────────────────────
WHY THESE EIGHT OSCILLATORS
──────────────────────────
Many multi-oscillator tools stack indicators that are nearly the same math, such as Stochastic %K and Williams %R, or RSI and CMO. When that happens, a "strong confluence" reading is often just one signal counted two or three times. This radar uses eight oscillators that each measure a different thing:
- RSI: momentum of closing prices (Wilder smoothing)
- STOCH: where price sits inside its recent high/low range (%K, 3-period smoothing)
- MFI: volume-weighted momentum (money flow)
- DMI: directional balance, meaning the +DI share of total directional movement
- AROON: trend timing, meaning how recently new highs were made compared with new lows
- CORR: trend quality, meaning how straight and steady price has moved over time (Pearson correlation vs. time)
- %B: volatility-adjusted position inside 2-standard-deviation Bollinger Bands (clamped 0–100)
- %UP: breadth of buying, meaning the percentage of up closes in the lookback window
All eight share one Length input (default 14) and can be smoothed with an optional EMA.
──────────────────────────
HOW TO READ THE RADAR
──────────────────────────
- Center = 0, outer edge = 100.
- Dashed ring = 50 (neutral).
- Dotted green ring = bull zone (default 70).
- Dotted red ring = bear zone (default 30).
The filled shape is the current reading of all eight oscillators, colored by the composite score:
- Green/teal: bullish (composite above 50)
- Purple: neutral (around 50)
- Red/pink: bearish (composite below 50)
What the shape tells you:
- A large, even shape pushed toward the outer ring means broad bullish agreement.
- A small shape pulled toward the center means broad bearish agreement.
- A lopsided or spiky shape means the oscillators disagree. That is often the most useful read, because it shows which kind of strength or weakness is missing. For example, strong RSI and STOCH with weak MFI means price is moving but volume isn't backing it.
Each axis label shows the oscillator's current value. An arrow (▲ / ▼) appears when that oscillator has risen or fallen since the previous history layer. Hover over any label for a short description of that oscillator.
──────────────────────────
THE 3D VIEW
──────────────────────────
With 3D enabled, the radar is tilted and rotated with perspective. Behind it are "history layers": snapshots of the radar from earlier bars (default: 5 layers, 4 bars apart). Older layers fade out and sit further back.
- The dashed spine running from the center is the time axis.
- Curved trails connect each oscillator through the history layers, so you can see whether that axis is expanding (gaining strength) or contracting (fading).
- If the layers expand as they come forward, momentum is building. If they shrink, momentum is fading.
Turn 3D off for a flat radar. The history layers then appear as faint outlines behind the current shape.
──────────────────────────
COMPOSITE GAUGE & SUMMARY
──────────────────────────
The vertical gradient bar on the right is the Composite Gauge, the average of all active oscillators (0–100). The ◀ marker shows the current composite value.
The summary label below the radar shows:
- Composite score and bias. BULLISH is 55 or above, BEARISH is 45 or below, and anything in between is NEUTRAL.
- Bull zone count: how many oscillators are at or above the bull level.
- Bear zone count: how many oscillators are at or below the bear level.
The Composite and both zone counts also appear in the Data Window, so you can read them on any historical bar.
──────────────────────────
SUGGESTED WAYS TO USE IT
──────────────────────────
1. Confirmation, not a trigger. Use the radar to check whether your setup has broad support across different kinds of signal before you act on your own entry criteria.
2. Look for divergence inside the radar. When price makes a new high but the shape shrinks, or one family such as MFI or CORR lags behind, the move may be losing support.
3. Watch the transitions. A composite cross of 50, or several oscillators entering a zone at once, often matters more than any single oscillator hitting an extreme.
4. Compare timeframes. Load the indicator on a higher and a lower timeframe to see whether the shapes agree.
──────────────────────────
SETTINGS OVERVIEW
──────────────────────────
Oscillators: Source, Length, Smoothing, and an on/off toggle for each oscillator (at least 3 must be on).
Levels & Alerts: Bull and bear zone levels, and the minimum number of oscillators needed for a confluence alert.
Layout: Vertical range lookback, radar height, radar width (in bars), gap from the last bar, and toggles for labels, gauge, and summary.
3D Engine: 3D on/off, tilt, rotation, camera distance (perspective strength), number of history layers, bars between layers, layer spacing, and axis trails.
Style: Bull, neutral, bear, and grid colors.
──────────────────────────
ALERTS
──────────────────────────
Create an alert and pick "Any alert() function call." It fires once per bar close when:
- The composite crosses above 50
- The composite crosses below 50
- The number of oscillators in the bull zone reaches the confluence count
- The number of oscillators in the bear zone reaches the confluence count
──────────────────────────
NOTES
──────────────────────────
- The radar is drawn in the empty space to the right of the last bar. If you don't see it, scroll right or increase the chart's right margin.
- The radar's proportions change as you zoom in and out. Adjust "Radar radius (bars)" and "Radar height" to fit your chart.
- MFI requires volume data. On symbols without volume it reads a flat 50.
- Values on the current, unfinished bar update in real time and can change until the bar closes. Alerts fire on bar close only.
──────────────────────────
DISCLAIMER
──────────────────────────
This script is provided for educational and informational purposes only. It is not financial advice, investment advice, or a recommendation to buy or sell any security, futures contract, or other financial instrument. Oscillators describe past price and volume behavior and do not predict future results. Past performance is not indicative of future results. Trading involves substantial risk of loss and is not suitable for every investor. Always do your own research, test any tool thoroughly before relying on it, and consider consulting a licensed financial professional. The author accepts no liability for any losses resulting from the use of this script.
Eight different oscillators, one picture. This indicator normalizes eight oscillators to a common 0–100 scale and plots them as a radar (spider) chart to the right of your price action. A 3D engine tilts the radar and stacks past snapshots behind it, so you can see not only where momentum is now but how it got there.
──────────────────────────
WHY THESE EIGHT OSCILLATORS
──────────────────────────
Many multi-oscillator tools stack indicators that are nearly the same math, such as Stochastic %K and Williams %R, or RSI and CMO. When that happens, a "strong confluence" reading is often just one signal counted two or three times. This radar uses eight oscillators that each measure a different thing:
- RSI: momentum of closing prices (Wilder smoothing)
- STOCH: where price sits inside its recent high/low range (%K, 3-period smoothing)
- MFI: volume-weighted momentum (money flow)
- DMI: directional balance, meaning the +DI share of total directional movement
- AROON: trend timing, meaning how recently new highs were made compared with new lows
- CORR: trend quality, meaning how straight and steady price has moved over time (Pearson correlation vs. time)
- %B: volatility-adjusted position inside 2-standard-deviation Bollinger Bands (clamped 0–100)
- %UP: breadth of buying, meaning the percentage of up closes in the lookback window
All eight share one Length input (default 14) and can be smoothed with an optional EMA.
──────────────────────────
HOW TO READ THE RADAR
──────────────────────────
- Center = 0, outer edge = 100.
- Dashed ring = 50 (neutral).
- Dotted green ring = bull zone (default 70).
- Dotted red ring = bear zone (default 30).
The filled shape is the current reading of all eight oscillators, colored by the composite score:
- Green/teal: bullish (composite above 50)
- Purple: neutral (around 50)
- Red/pink: bearish (composite below 50)
What the shape tells you:
- A large, even shape pushed toward the outer ring means broad bullish agreement.
- A small shape pulled toward the center means broad bearish agreement.
- A lopsided or spiky shape means the oscillators disagree. That is often the most useful read, because it shows which kind of strength or weakness is missing. For example, strong RSI and STOCH with weak MFI means price is moving but volume isn't backing it.
Each axis label shows the oscillator's current value. An arrow (▲ / ▼) appears when that oscillator has risen or fallen since the previous history layer. Hover over any label for a short description of that oscillator.
──────────────────────────
THE 3D VIEW
──────────────────────────
With 3D enabled, the radar is tilted and rotated with perspective. Behind it are "history layers": snapshots of the radar from earlier bars (default: 5 layers, 4 bars apart). Older layers fade out and sit further back.
- The dashed spine running from the center is the time axis.
- Curved trails connect each oscillator through the history layers, so you can see whether that axis is expanding (gaining strength) or contracting (fading).
- If the layers expand as they come forward, momentum is building. If they shrink, momentum is fading.
Turn 3D off for a flat radar. The history layers then appear as faint outlines behind the current shape.
──────────────────────────
COMPOSITE GAUGE & SUMMARY
──────────────────────────
The vertical gradient bar on the right is the Composite Gauge, the average of all active oscillators (0–100). The ◀ marker shows the current composite value.
The summary label below the radar shows:
- Composite score and bias. BULLISH is 55 or above, BEARISH is 45 or below, and anything in between is NEUTRAL.
- Bull zone count: how many oscillators are at or above the bull level.
- Bear zone count: how many oscillators are at or below the bear level.
The Composite and both zone counts also appear in the Data Window, so you can read them on any historical bar.
──────────────────────────
SUGGESTED WAYS TO USE IT
──────────────────────────
1. Confirmation, not a trigger. Use the radar to check whether your setup has broad support across different kinds of signal before you act on your own entry criteria.
2. Look for divergence inside the radar. When price makes a new high but the shape shrinks, or one family such as MFI or CORR lags behind, the move may be losing support.
3. Watch the transitions. A composite cross of 50, or several oscillators entering a zone at once, often matters more than any single oscillator hitting an extreme.
4. Compare timeframes. Load the indicator on a higher and a lower timeframe to see whether the shapes agree.
──────────────────────────
SETTINGS OVERVIEW
──────────────────────────
Oscillators: Source, Length, Smoothing, and an on/off toggle for each oscillator (at least 3 must be on).
Levels & Alerts: Bull and bear zone levels, and the minimum number of oscillators needed for a confluence alert.
Layout: Vertical range lookback, radar height, radar width (in bars), gap from the last bar, and toggles for labels, gauge, and summary.
3D Engine: 3D on/off, tilt, rotation, camera distance (perspective strength), number of history layers, bars between layers, layer spacing, and axis trails.
Style: Bull, neutral, bear, and grid colors.
──────────────────────────
ALERTS
──────────────────────────
Create an alert and pick "Any alert() function call." It fires once per bar close when:
- The composite crosses above 50
- The composite crosses below 50
- The number of oscillators in the bull zone reaches the confluence count
- The number of oscillators in the bear zone reaches the confluence count
──────────────────────────
NOTES
──────────────────────────
- The radar is drawn in the empty space to the right of the last bar. If you don't see it, scroll right or increase the chart's right margin.
- The radar's proportions change as you zoom in and out. Adjust "Radar radius (bars)" and "Radar height" to fit your chart.
- MFI requires volume data. On symbols without volume it reads a flat 50.
- Values on the current, unfinished bar update in real time and can change until the bar closes. Alerts fire on bar close only.
──────────────────────────
DISCLAIMER
──────────────────────────
This script is provided for educational and informational purposes only. It is not financial advice, investment advice, or a recommendation to buy or sell any security, futures contract, or other financial instrument. Oscillators describe past price and volume behavior and do not predict future results. Past performance is not indicative of future results. Trading involves substantial risk of loss and is not suitable for every investor. Always do your own research, test any tool thoroughly before relying on it, and consider consulting a licensed financial professional. The author accepts no liability for any losses resulting from the use of this script.
Script open-source
Nello spirito di TradingView, l'autore di questo script lo ha reso open source, in modo che i trader possano esaminarne e verificarne la funzionalità. Complimenti all'autore! Sebbene sia possibile utilizzarlo gratuitamente, ricordiamo che la ripubblicazione del codice è soggetta al nostro Regolamento.

Declinazione di responsabilità
Le informazioni e le pubblicazioni non sono intese come, e non costituiscono, consulenza o raccomandazioni finanziarie, di investimento, di trading o di altro tipo fornite o approvate da TradingView. Per ulteriori informazioni, consultare i Termini di utilizzo.
Script open-source
Nello spirito di TradingView, l'autore di questo script lo ha reso open source, in modo che i trader possano esaminarne e verificarne la funzionalità. Complimenti all'autore! Sebbene sia possibile utilizzarlo gratuitamente, ricordiamo che la ripubblicazione del codice è soggetta al nostro Regolamento.
Declinazione di responsabilità
Le informazioni e le pubblicazioni non sono intese come, e non costituiscono, consulenza o raccomandazioni finanziarie, di investimento, di trading o di altro tipo fornite o approvate da TradingView. Per ulteriori informazioni, consultare i Termini di utilizzo.