OPEN-SOURCE SCRIPT
Normalized Coefficient of Variation
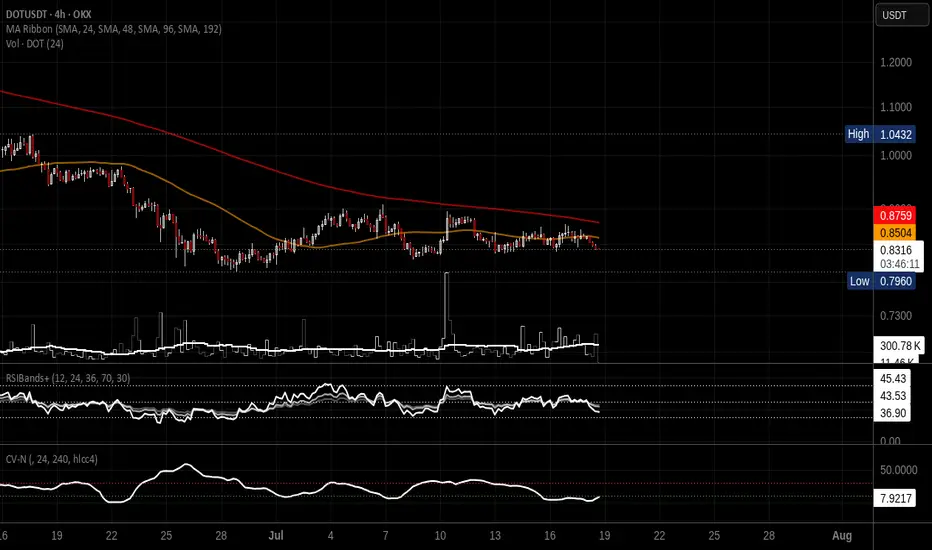
# Normalized Coefficient of Variation (CV)
This indicator measures market volatility using the **Coefficient of Variation (CV)**, defined as the ratio of the standard deviation to the simple moving average (SMA), expressed as a percentage.
Unlike the traditional CV, which has no upper limit and can vary significantly across different assets and market conditions, this indicator applies a **Rolling Min-Max Normalization** over a user-defined lookback period. The result is a dynamic oscillator scaled between **0 and 100**, making it easier to compare relative volatility across different symbols and timeframes.
## Formula
**Coefficient of Variation**
CV = (Standard Deviation / SMA) × 100
**Normalization**
Normalized CV = 100 × (CV − Lowest CV) / (Highest CV − Lowest CV)
where the lowest and highest CV values are calculated over the selected normalization lookback period.
## Features
* Rolling Min-Max normalization (0-100 scale)
* User-selectable calculation timeframe
* Adjustable CV period (default: 24)
* Adjustable normalization lookback (default: 250)
* Uses Simple Moving Average (SMA)
* White oscillator line for clear visualization
* Dotted reference levels at 10 and 30
* Hidden raw CV value available in the Data Window
## Interpretation
* Values below **10** indicate relatively low volatility compared to recent history.
* Values above **30** indicate relatively high volatility compared to recent history.
* Values approaching **100** represent the highest relative volatility observed within the selected normalization window.
* Values approaching **0** represent the lowest relative volatility observed within the selected normalization window.
Because the indicator is normalized, the displayed values represent **relative volatility within the selected lookback period**, not the absolute Coefficient of Variation percentage. This makes the indicator especially useful for comparing changing volatility regimes across different markets and timeframes.
This indicator is intended as a volatility analysis tool and should be used alongside price action and other technical indicators rather than as a standalone trading signal.
This indicator measures market volatility using the **Coefficient of Variation (CV)**, defined as the ratio of the standard deviation to the simple moving average (SMA), expressed as a percentage.
Unlike the traditional CV, which has no upper limit and can vary significantly across different assets and market conditions, this indicator applies a **Rolling Min-Max Normalization** over a user-defined lookback period. The result is a dynamic oscillator scaled between **0 and 100**, making it easier to compare relative volatility across different symbols and timeframes.
## Formula
**Coefficient of Variation**
CV = (Standard Deviation / SMA) × 100
**Normalization**
Normalized CV = 100 × (CV − Lowest CV) / (Highest CV − Lowest CV)
where the lowest and highest CV values are calculated over the selected normalization lookback period.
## Features
* Rolling Min-Max normalization (0-100 scale)
* User-selectable calculation timeframe
* Adjustable CV period (default: 24)
* Adjustable normalization lookback (default: 250)
* Uses Simple Moving Average (SMA)
* White oscillator line for clear visualization
* Dotted reference levels at 10 and 30
* Hidden raw CV value available in the Data Window
## Interpretation
* Values below **10** indicate relatively low volatility compared to recent history.
* Values above **30** indicate relatively high volatility compared to recent history.
* Values approaching **100** represent the highest relative volatility observed within the selected normalization window.
* Values approaching **0** represent the lowest relative volatility observed within the selected normalization window.
Because the indicator is normalized, the displayed values represent **relative volatility within the selected lookback period**, not the absolute Coefficient of Variation percentage. This makes the indicator especially useful for comparing changing volatility regimes across different markets and timeframes.
This indicator is intended as a volatility analysis tool and should be used alongside price action and other technical indicators rather than as a standalone trading signal.
Script open-source
Nello spirito di TradingView, l'autore di questo script lo ha reso open source, in modo che i trader possano esaminarne e verificarne la funzionalità. Complimenti all'autore! Sebbene sia possibile utilizzarlo gratuitamente, ricordiamo che la ripubblicazione del codice è soggetta al nostro Regolamento.

Declinazione di responsabilità
Le informazioni e le pubblicazioni non sono intese come, e non costituiscono, consulenza o raccomandazioni finanziarie, di investimento, di trading o di altro tipo fornite o approvate da TradingView. Per ulteriori informazioni, consultare i Termini di utilizzo.
Script open-source
Nello spirito di TradingView, l'autore di questo script lo ha reso open source, in modo che i trader possano esaminarne e verificarne la funzionalità. Complimenti all'autore! Sebbene sia possibile utilizzarlo gratuitamente, ricordiamo che la ripubblicazione del codice è soggetta al nostro Regolamento.
Declinazione di responsabilità
Le informazioni e le pubblicazioni non sono intese come, e non costituiscono, consulenza o raccomandazioni finanziarie, di investimento, di trading o di altro tipo fornite o approvate da TradingView. Per ulteriori informazioni, consultare i Termini di utilizzo.