OPEN-SOURCE SCRIPT
OB Identify + Verify v1.8
OB Identify + Verify
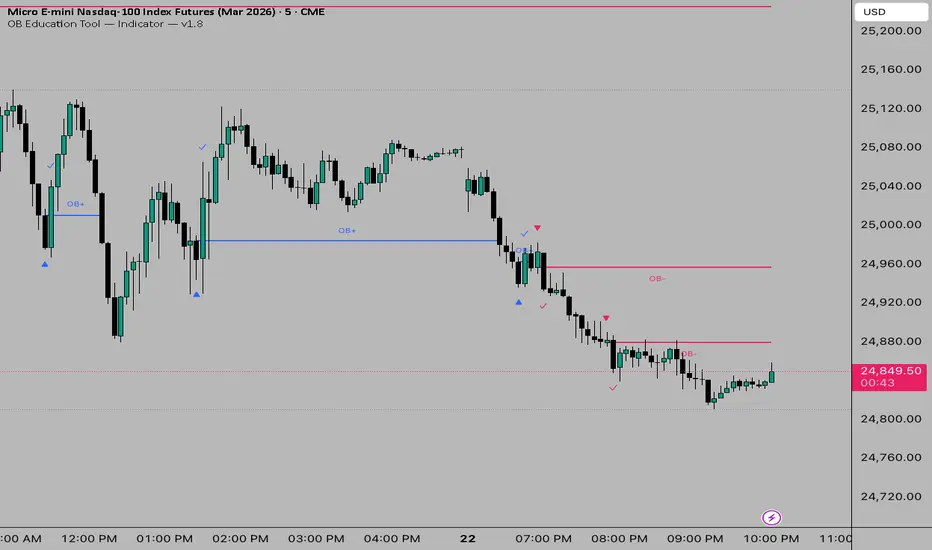
An educational tool to help you identify and verify ICT-style Order Blocks on any timeframe. It marks the key candles involved in OB formation so you can learn to spot them yourself.
━━━ CHART LEGEND ━━━
▲ = Bullish OB candle (last down-close before upward displacement)
▼ = Bearish OB candle (last up-close before downward displacement)
✓ = Displacement confirmed (candle closed beyond OB open)
OB+ = Bullish Order Block — expect price to find support here
OB- = Bearish Order Block — expect price to find resistance here
━━━ HOW ORDER BLOCKS FORM ━━━
Bullish OB (OB+)
1. A down-close candle forms (sellers in control)
2. The next candle displaces upward and CLOSES ABOVE the down-close candle's open
3. The down-close candle is now marked as the Order Block
4. Price may return to this level as SUPPORT
Bearish OB (OB-)
1. An up-close candle forms (buyers in control)
2. The next candle displaces downward and CLOSES BELOW the up-close candle's open
3. The up-close candle is now marked as the Order Block
4. Price may return to this level as RESISTANCE
━━━ WHEN IS AN OB INVALIDATED? ━━━
An Order Block is invalidated when price CLOSES THROUGH the OB level:
• OB+ invalid = price closes BELOW the line
• OB- invalid = price closes ABOVE the line
The line will stop extending when this happens (if "Stop Line at Mitigation" is enabled).
━━━ HOW TO USE THIS INDICATOR ━━━
Step 1: Identify
Look for the ▲/▼ markers — these show you which candle is the Order Block.
Step 2: Verify
The ✓ confirms that displacement was strong enough. No checkmark = no valid OB.
Step 3: Wait for Return
Price often returns to OB levels. Watch for price to come back to the OB+ line (support) or OB- line (resistance).
Step 4: Confirm Context
IMPORTANT: This indicator detects the pattern only. For higher-probability setups, verify that the OB forms at a significant level such as:
• Higher timeframe Fair Value Gap (FVG)
• Previous Order Block
• Liquidity sweep (swing high/low taken)
• Key support/resistance
━━━ SETTINGS GUIDE ━━━
ATR Multiplier (Displacement Filter)
Controls how strong the displacement candle must be:
• 0.5 = More OBs, some weaker
• 1.0 = Balanced (default)
• 1.5+ = Fewer OBs, higher quality
Timeframe suggestions:
• 1m charts: 0.8 – 1.2
• 5m charts: 0.5 – 1.0
• 15m charts: 0.5 – 0.8
• 4H charts: 0.3 – 0.7
Max OBs
Limits how many OBs display to keep your chart clean. Default is 5 each for bullish/bearish.
Stop Line at Mitigation
When ON, the OB line ends when price closes through it (invalidation). When OFF, lines extend indefinitely.
━━━ TIPS FOR LEARNING ━━━
1. Start with markers ON — watch how OBs form in real-time
2. Increase ATR multiplier if you see too many weak OBs
3. Zoom out — check if the OB aligns with higher timeframe levels
4. Practice identifying the OB candle before the indicator marks it
━━━ CREDITS ━━━
Based on ICT (Inner Circle Trader) Order Block concepts. Built for educational purposes to help traders learn to identify these patterns independently.
An educational tool to help you identify and verify ICT-style Order Blocks on any timeframe. It marks the key candles involved in OB formation so you can learn to spot them yourself.
━━━ CHART LEGEND ━━━
▲ = Bullish OB candle (last down-close before upward displacement)
▼ = Bearish OB candle (last up-close before downward displacement)
✓ = Displacement confirmed (candle closed beyond OB open)
OB+ = Bullish Order Block — expect price to find support here
OB- = Bearish Order Block — expect price to find resistance here
━━━ HOW ORDER BLOCKS FORM ━━━
Bullish OB (OB+)
1. A down-close candle forms (sellers in control)
2. The next candle displaces upward and CLOSES ABOVE the down-close candle's open
3. The down-close candle is now marked as the Order Block
4. Price may return to this level as SUPPORT
Bearish OB (OB-)
1. An up-close candle forms (buyers in control)
2. The next candle displaces downward and CLOSES BELOW the up-close candle's open
3. The up-close candle is now marked as the Order Block
4. Price may return to this level as RESISTANCE
━━━ WHEN IS AN OB INVALIDATED? ━━━
An Order Block is invalidated when price CLOSES THROUGH the OB level:
• OB+ invalid = price closes BELOW the line
• OB- invalid = price closes ABOVE the line
The line will stop extending when this happens (if "Stop Line at Mitigation" is enabled).
━━━ HOW TO USE THIS INDICATOR ━━━
Step 1: Identify
Look for the ▲/▼ markers — these show you which candle is the Order Block.
Step 2: Verify
The ✓ confirms that displacement was strong enough. No checkmark = no valid OB.
Step 3: Wait for Return
Price often returns to OB levels. Watch for price to come back to the OB+ line (support) or OB- line (resistance).
Step 4: Confirm Context
IMPORTANT: This indicator detects the pattern only. For higher-probability setups, verify that the OB forms at a significant level such as:
• Higher timeframe Fair Value Gap (FVG)
• Previous Order Block
• Liquidity sweep (swing high/low taken)
• Key support/resistance
━━━ SETTINGS GUIDE ━━━
ATR Multiplier (Displacement Filter)
Controls how strong the displacement candle must be:
• 0.5 = More OBs, some weaker
• 1.0 = Balanced (default)
• 1.5+ = Fewer OBs, higher quality
Timeframe suggestions:
• 1m charts: 0.8 – 1.2
• 5m charts: 0.5 – 1.0
• 15m charts: 0.5 – 0.8
• 4H charts: 0.3 – 0.7
Max OBs
Limits how many OBs display to keep your chart clean. Default is 5 each for bullish/bearish.
Stop Line at Mitigation
When ON, the OB line ends when price closes through it (invalidation). When OFF, lines extend indefinitely.
━━━ TIPS FOR LEARNING ━━━
1. Start with markers ON — watch how OBs form in real-time
2. Increase ATR multiplier if you see too many weak OBs
3. Zoom out — check if the OB aligns with higher timeframe levels
4. Practice identifying the OB candle before the indicator marks it
━━━ CREDITS ━━━
Based on ICT (Inner Circle Trader) Order Block concepts. Built for educational purposes to help traders learn to identify these patterns independently.
Script open-source
Nello spirito di TradingView, l'autore di questo script lo ha reso open source, in modo che i trader possano esaminarne e verificarne la funzionalità. Complimenti all'autore! Sebbene sia possibile utilizzarlo gratuitamente, ricordiamo che la ripubblicazione del codice è soggetta al nostro Regolamento.

Declinazione di responsabilità
Le informazioni e le pubblicazioni non sono intese come, e non costituiscono, consulenza o raccomandazioni finanziarie, di investimento, di trading o di altro tipo fornite o approvate da TradingView. Per ulteriori informazioni, consultare i Termini di utilizzo.
Script open-source
Nello spirito di TradingView, l'autore di questo script lo ha reso open source, in modo che i trader possano esaminarne e verificarne la funzionalità. Complimenti all'autore! Sebbene sia possibile utilizzarlo gratuitamente, ricordiamo che la ripubblicazione del codice è soggetta al nostro Regolamento.
Declinazione di responsabilità
Le informazioni e le pubblicazioni non sono intese come, e non costituiscono, consulenza o raccomandazioni finanziarie, di investimento, di trading o di altro tipo fornite o approvate da TradingView. Per ulteriori informazioni, consultare i Termini di utilizzo.