Market Bottom Finder [Quantum Algo]
Market Bottom Finder [Quantum Algo]
═══════════════════════════════════════════════
🔶 OVERVIEW
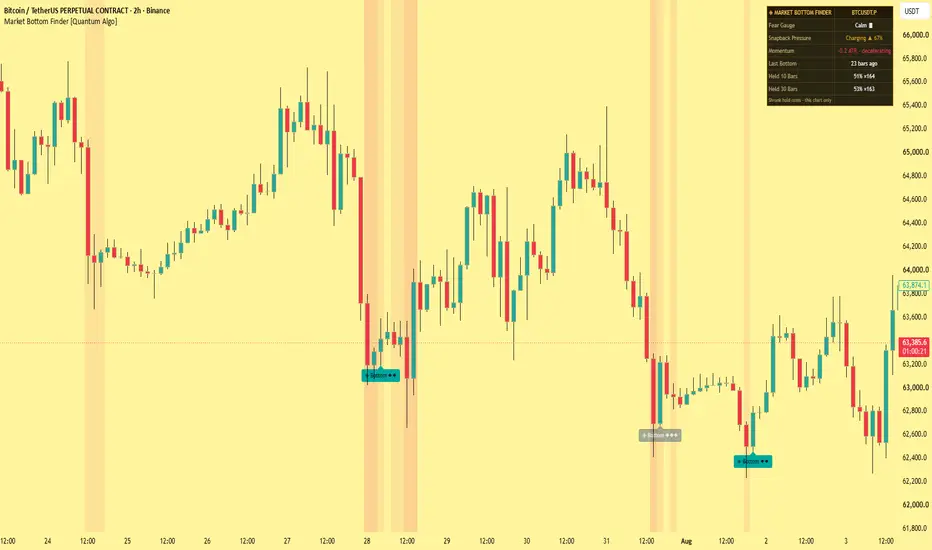
Market Bottom Finder is a capitulation detector. It watches for the moment panic selling exhausts itself — the fear spike, the final violent flush, the volume climax, the long rejection wick — and marks that bar as a graded bottom candidate directly on your chart.
The engine is built on the Williams Vix Fix, the classic synthetic fear gauge, and extends it with four additional independent witnesses: an accumulated-stretch pressure integral, momentum-exhaustion analysis, a volume climax filter, and oscillator divergence. The more witnesses agree, the higher the grade — and a five-witness alignment prints as a gold Capitulation marker.
What makes this tool different from every other bottom indicator is accountability: every marker SETTLES. A fixed number of bars after it prints, each marker is recolored by what actually happened — solid if price held above the detected low, faded if it failed. Your chart displays the tool's genuine historical hit rate at all times. No hindsight highlight reel is possible, because the failures stay visible.
═══════════════════════════════════════════════
🔶 WHAT IS A MARKET BOTTOM?
A durable market bottom is rarely a quiet event. It is usually a capitulation: the point where fearful holders finally surrender, selling accelerates into a climax, and the supply of panic sellers runs out. The signature is consistent across markets and decades — a spike in the fear gauge, unusually fast downward movement that suddenly decelerates, climactic volume, and a candle that dives deep and closes far off its low.
This indicator formalizes that signature into measurable conditions and requires several of them to align at once.
═══════════════════════════════════════════════
🔶 WHAT IS THE WILLIAMS VIX FIX?
The Vix Fix, created by Larry Williams, synthesizes a volatility-index-style fear reading from price alone: it measures how far the current low has fallen from the highest close of the recent window. When that distance expands violently, fear is spiking — on any symbol, including those with no options market and no published volatility index.
This script extends the classic gauge with an adaptive threshold: a spike is defined as the gauge exceeding a high percentile of its own recent history, so the definition of "extreme fear" recalibrates automatically to every symbol, timeframe and volatility regime.
═══════════════════════════════════════════════
🔶 WHY IS THIS ORIGINAL?
1. Adaptive fear threshold. Fixed trigger levels fail across symbols; this gauge defines extremity from the symbol's own distribution.
2. Snapback Pressure. An accumulated-stretch integral, inspired by the action-integral form used in physics as a modeling device: the longer and deeper price stays extended below its long-term average, the more the pressure charges toward one hundred percent. A single red candle barely moves it; sustained capitulation charges it fully. Bottoms require charged pressure — depth AND duration, not depth alone.
3. Witness grading. Fear extremity, volume climax, wick rejection, oscillator divergence and high pressure are counted as independent witnesses. Grades are shown as diamonds on every marker; five or more prints a gold Capitulation.
4. Settling markers. Every marker resolves into its real outcome after a fixed window, in public, on the chart. The tool grades its own homework.
5. Two-horizon statistics. The dashboard reports how often detected bottoms held after ten and after thirty bars — computed on your exact chart, shrunk toward neutral at small samples, with Wilson lower bounds available. Each new marker's tooltip quotes the historical hold rate at the moment it prints.
═══════════════════════════════════════════════
🔶 HOW IT WORKS
— The fear gauge is computed each bar and compared against its adaptive percentile threshold; spikes paint a translucent fear wash on the chart.
— Downward momentum is measured in Average True Range units; a bottom requires a genuinely violent arrival that has begun decelerating.
— The pressure integral accumulates while price is stretched below its long-term average and decays quickly once it re-enters.
— When a fear spike, exhausted momentum and charged pressure coincide, a bottom candidate prints and is graded by the remaining witnesses.
— After the settle window, the marker is recolored by outcome, and the ten- and thirty-bar results feed the statistics panel.
All detection happens on confirmed bars. Markers do not repaint; a settled marker never changes again.
═══════════════════════════════════════════════
🔶 HOW TO USE IT
— As a context tool: the fear wash and pressure row tell you when conditions for a durable low are building, before any marker prints.
— As a confirmation layer: combine a Capitulation marker with your own support levels, volume profile or higher-timeframe structure rather than acting on it in isolation.
— Grade discipline: the gold five-plus-witness Capitulations are historically the events worth the most attention; single-diamond bottoms are early warnings, not conclusions.
— Read your chart's own statistics first: the Held rows tell you how this exact symbol and timeframe has responded historically.
— Works on all markets — crypto, stocks, indices, forex — on timeframes from 1H to Weekly. Mirror top detection is available as an optional toggle.
═══════════════════════════════════════════════
🔶 SETTINGS
— Fear Gauge: lookback, adaptive threshold window and percentile, chart wash toggle.
— Bottom Detection: minimum momentum, minimum pressure, volume climax level, cooldown, settle window, markers kept, optional top mirror.
— Statistics: sample cap, minimum samples, shrinkage strength, Wilson z-score.
— Full color and dashboard customization.
═══════════════════════════════════════════════
🔶 ALERTS
— Fear Spike — the gauge crossed its adaptive threshold.
— Bottom Detected — fear, exhaustion and charged pressure aligned.
— Capitulation (Grade A) — five or more witnesses aligned.
— Top Detected — mirror logic, when enabled.
═══════════════════════════════════════════════
🔶 FAQ
Q: Does it repaint?
A: No. Detection uses confirmed bars only, and settled markers are permanent. The settling recolor is the tool honestly reporting an outcome, not a signal changing.
Q: Does it catch every bottom?
A: No, and it is not designed to. It detects capitulation-style bottoms — the panic-flush signature. Slow, quiet rounded bottoms without a fear spike will not qualify. Requiring the full signature is what keeps the marker meaningful.
Q: Why did a marker print and price still went lower?
A: Because no bottom detector is right every time — and this is the only one that shows you exactly how often it is right, on your chart, via the settled markers and the Held statistics. Capitulation events historically cluster near durable lows; they do not guarantee them.
Q: What do the Held percentages mean?
A: The share of past detected bottoms after which price was higher ten and thirty bars later, on the current symbol and timeframe. Small samples are shrunk toward fifty percent so early numbers cannot overstate the edge. They describe history; they are not predictions.
Q: Which settings should I change first?
A: The Fear Spike Percentile (higher = rarer, stronger events) and the Minimum Snapback Pressure (higher = demands more sustained capitulation).
═══════════════════════════════════════════════
🔶 CREDITS
The Vix Fix synthetic fear gauge is by Larry Williams. The Relative Strength Index and Average True Range are by J. Welles Wilder Jr. (1978). The pressure integral follows the action-integral form of Wentzel, Kramers and Brillouin (1926), used strictly as a modeling device. The Wilson score interval is by Edwin B. Wilson (1927). The adaptive threshold, witness grading engine, settling audit, per-symbol statistics and all code in this script are original work — no third-party or open-source script code was reused.
═══════════════════════════════════════════════
🔶 LIMITATIONS
— Capitulation detection identifies panic exhaustion; it cannot identify news-driven regime changes or slow structural declines.
— Statistics describe the current chart's history only; past frequencies never guarantee future outcomes.
— On illiquid symbols, volume-based witnesses are less reliable.
═══════════════════════════════════════════════
🔶 DISCLAIMER
This indicator is a research and charting tool provided for educational purposes. It is not financial advice, and nothing it displays is a recommendation to buy or sell any asset. Trading involves substantial risk of loss. Always do your own analysis and manage risk responsibly.
═══════════════════════════════════════════════
🔶 OVERVIEW
Market Bottom Finder is a capitulation detector. It watches for the moment panic selling exhausts itself — the fear spike, the final violent flush, the volume climax, the long rejection wick — and marks that bar as a graded bottom candidate directly on your chart.
The engine is built on the Williams Vix Fix, the classic synthetic fear gauge, and extends it with four additional independent witnesses: an accumulated-stretch pressure integral, momentum-exhaustion analysis, a volume climax filter, and oscillator divergence. The more witnesses agree, the higher the grade — and a five-witness alignment prints as a gold Capitulation marker.
What makes this tool different from every other bottom indicator is accountability: every marker SETTLES. A fixed number of bars after it prints, each marker is recolored by what actually happened — solid if price held above the detected low, faded if it failed. Your chart displays the tool's genuine historical hit rate at all times. No hindsight highlight reel is possible, because the failures stay visible.
═══════════════════════════════════════════════
🔶 WHAT IS A MARKET BOTTOM?
A durable market bottom is rarely a quiet event. It is usually a capitulation: the point where fearful holders finally surrender, selling accelerates into a climax, and the supply of panic sellers runs out. The signature is consistent across markets and decades — a spike in the fear gauge, unusually fast downward movement that suddenly decelerates, climactic volume, and a candle that dives deep and closes far off its low.
This indicator formalizes that signature into measurable conditions and requires several of them to align at once.
═══════════════════════════════════════════════
🔶 WHAT IS THE WILLIAMS VIX FIX?
The Vix Fix, created by Larry Williams, synthesizes a volatility-index-style fear reading from price alone: it measures how far the current low has fallen from the highest close of the recent window. When that distance expands violently, fear is spiking — on any symbol, including those with no options market and no published volatility index.
This script extends the classic gauge with an adaptive threshold: a spike is defined as the gauge exceeding a high percentile of its own recent history, so the definition of "extreme fear" recalibrates automatically to every symbol, timeframe and volatility regime.
═══════════════════════════════════════════════
🔶 WHY IS THIS ORIGINAL?
1. Adaptive fear threshold. Fixed trigger levels fail across symbols; this gauge defines extremity from the symbol's own distribution.
2. Snapback Pressure. An accumulated-stretch integral, inspired by the action-integral form used in physics as a modeling device: the longer and deeper price stays extended below its long-term average, the more the pressure charges toward one hundred percent. A single red candle barely moves it; sustained capitulation charges it fully. Bottoms require charged pressure — depth AND duration, not depth alone.
3. Witness grading. Fear extremity, volume climax, wick rejection, oscillator divergence and high pressure are counted as independent witnesses. Grades are shown as diamonds on every marker; five or more prints a gold Capitulation.
4. Settling markers. Every marker resolves into its real outcome after a fixed window, in public, on the chart. The tool grades its own homework.
5. Two-horizon statistics. The dashboard reports how often detected bottoms held after ten and after thirty bars — computed on your exact chart, shrunk toward neutral at small samples, with Wilson lower bounds available. Each new marker's tooltip quotes the historical hold rate at the moment it prints.
═══════════════════════════════════════════════
🔶 HOW IT WORKS
— The fear gauge is computed each bar and compared against its adaptive percentile threshold; spikes paint a translucent fear wash on the chart.
— Downward momentum is measured in Average True Range units; a bottom requires a genuinely violent arrival that has begun decelerating.
— The pressure integral accumulates while price is stretched below its long-term average and decays quickly once it re-enters.
— When a fear spike, exhausted momentum and charged pressure coincide, a bottom candidate prints and is graded by the remaining witnesses.
— After the settle window, the marker is recolored by outcome, and the ten- and thirty-bar results feed the statistics panel.
All detection happens on confirmed bars. Markers do not repaint; a settled marker never changes again.
═══════════════════════════════════════════════
🔶 HOW TO USE IT
— As a context tool: the fear wash and pressure row tell you when conditions for a durable low are building, before any marker prints.
— As a confirmation layer: combine a Capitulation marker with your own support levels, volume profile or higher-timeframe structure rather than acting on it in isolation.
— Grade discipline: the gold five-plus-witness Capitulations are historically the events worth the most attention; single-diamond bottoms are early warnings, not conclusions.
— Read your chart's own statistics first: the Held rows tell you how this exact symbol and timeframe has responded historically.
— Works on all markets — crypto, stocks, indices, forex — on timeframes from 1H to Weekly. Mirror top detection is available as an optional toggle.
═══════════════════════════════════════════════
🔶 SETTINGS
— Fear Gauge: lookback, adaptive threshold window and percentile, chart wash toggle.
— Bottom Detection: minimum momentum, minimum pressure, volume climax level, cooldown, settle window, markers kept, optional top mirror.
— Statistics: sample cap, minimum samples, shrinkage strength, Wilson z-score.
— Full color and dashboard customization.
═══════════════════════════════════════════════
🔶 ALERTS
— Fear Spike — the gauge crossed its adaptive threshold.
— Bottom Detected — fear, exhaustion and charged pressure aligned.
— Capitulation (Grade A) — five or more witnesses aligned.
— Top Detected — mirror logic, when enabled.
═══════════════════════════════════════════════
🔶 FAQ
Q: Does it repaint?
A: No. Detection uses confirmed bars only, and settled markers are permanent. The settling recolor is the tool honestly reporting an outcome, not a signal changing.
Q: Does it catch every bottom?
A: No, and it is not designed to. It detects capitulation-style bottoms — the panic-flush signature. Slow, quiet rounded bottoms without a fear spike will not qualify. Requiring the full signature is what keeps the marker meaningful.
Q: Why did a marker print and price still went lower?
A: Because no bottom detector is right every time — and this is the only one that shows you exactly how often it is right, on your chart, via the settled markers and the Held statistics. Capitulation events historically cluster near durable lows; they do not guarantee them.
Q: What do the Held percentages mean?
A: The share of past detected bottoms after which price was higher ten and thirty bars later, on the current symbol and timeframe. Small samples are shrunk toward fifty percent so early numbers cannot overstate the edge. They describe history; they are not predictions.
Q: Which settings should I change first?
A: The Fear Spike Percentile (higher = rarer, stronger events) and the Minimum Snapback Pressure (higher = demands more sustained capitulation).
═══════════════════════════════════════════════
🔶 CREDITS
The Vix Fix synthetic fear gauge is by Larry Williams. The Relative Strength Index and Average True Range are by J. Welles Wilder Jr. (1978). The pressure integral follows the action-integral form of Wentzel, Kramers and Brillouin (1926), used strictly as a modeling device. The Wilson score interval is by Edwin B. Wilson (1927). The adaptive threshold, witness grading engine, settling audit, per-symbol statistics and all code in this script are original work — no third-party or open-source script code was reused.
═══════════════════════════════════════════════
🔶 LIMITATIONS
— Capitulation detection identifies panic exhaustion; it cannot identify news-driven regime changes or slow structural declines.
— Statistics describe the current chart's history only; past frequencies never guarantee future outcomes.
— On illiquid symbols, volume-based witnesses are less reliable.
═══════════════════════════════════════════════
🔶 DISCLAIMER
This indicator is a research and charting tool provided for educational purposes. It is not financial advice, and nothing it displays is a recommendation to buy or sell any asset. Trading involves substantial risk of loss. Always do your own analysis and manage risk responsibly.

The institutional Edge: Indicators, Strategies & a Free Academy. quantum-algo.com
All content provided by Quantum Algo is for informational & educational purposes only.
All content provided by Quantum Algo is for informational & educational purposes only.
Declinazione di responsabilità
Le informazioni e le pubblicazioni non sono intese come, e non costituiscono, consulenza o raccomandazioni finanziarie, di investimento, di trading o di altro tipo fornite o approvate da TradingView. Per ulteriori informazioni, consultare i Termini di utilizzo.
The institutional Edge: Indicators, Strategies & a Free Academy. quantum-algo.com
All content provided by Quantum Algo is for informational & educational purposes only.
All content provided by Quantum Algo is for informational & educational purposes only.
Declinazione di responsabilità
Le informazioni e le pubblicazioni non sono intese come, e non costituiscono, consulenza o raccomandazioni finanziarie, di investimento, di trading o di altro tipo fornite o approvate da TradingView. Per ulteriori informazioni, consultare i Termini di utilizzo.