Commodities in Gold
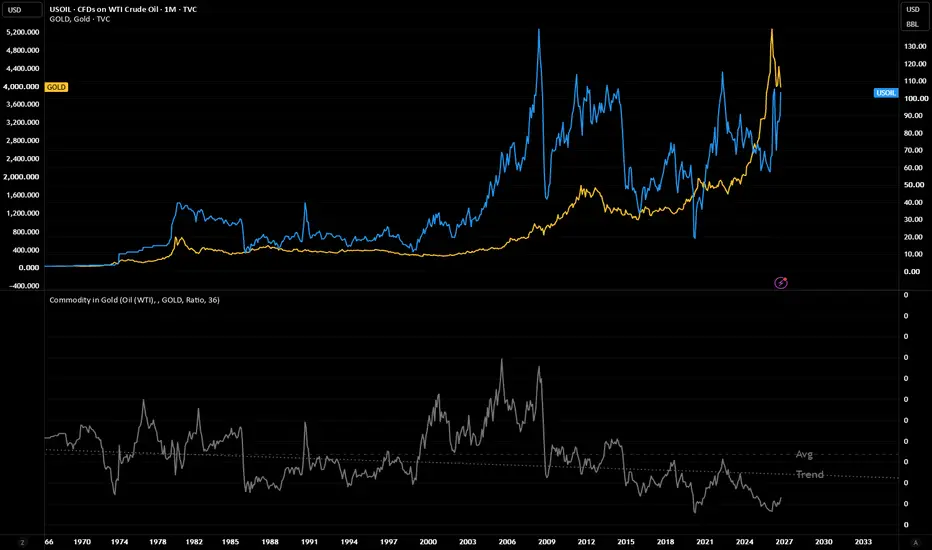
Prices a commodity in ounces of gold instead of dollars, and shows how far that ratio sits from its long-run and recent trend.
Modes
Ratio: commodity price ÷ gold price, with optional full-history average (Avg) and log-linear trend line (Trend).
Gap to trend %: percentage distance of the ratio from a rolling log-linear regression over N bars. Above zero means rich relative to gold on that horizon; below zero means cheap.
Inputs
Commodity: a preset list of energy, metals, grains, softs, livestock and the S&P 500, plus Chart symbol or Custom.
Gold: the denominator, TVC:GOLD by default.
Trend length: the rolling window for Gap mode. 240 bars on monthly ≈ 20 years (long-run value); 36 ≈ 3 years (short-term stretch).
How it’s calculated
Ratio = commodity close ÷ gold close.
Trend = least-squares fit of ln(ratio) against time, converted back with exp(). The Ratio-mode trend uses all loaded history; Gap mode refits on every bar using only the last N bars.
Notes
Best on a monthly chart with the pane on a log scale. The FRED/IMF series (aluminium, nickel, zinc, iron ore, uranium) are monthly.
History is limited to the main chart’s symbol. Use TVC:GOLD as the main chart for the longest data.
Grains and softs are quoted in cents, so ratio values are ×100. The shape and gaps are unaffected.
The S&P 500 preset is price only, excluding dividends. Use SP:SPXTR via Custom for total return.
Descriptive, not a timing signal.
Modes
Ratio: commodity price ÷ gold price, with optional full-history average (Avg) and log-linear trend line (Trend).
Gap to trend %: percentage distance of the ratio from a rolling log-linear regression over N bars. Above zero means rich relative to gold on that horizon; below zero means cheap.
Inputs
Commodity: a preset list of energy, metals, grains, softs, livestock and the S&P 500, plus Chart symbol or Custom.
Gold: the denominator, TVC:GOLD by default.
Trend length: the rolling window for Gap mode. 240 bars on monthly ≈ 20 years (long-run value); 36 ≈ 3 years (short-term stretch).
How it’s calculated
Ratio = commodity close ÷ gold close.
Trend = least-squares fit of ln(ratio) against time, converted back with exp(). The Ratio-mode trend uses all loaded history; Gap mode refits on every bar using only the last N bars.
Notes
Best on a monthly chart with the pane on a log scale. The FRED/IMF series (aluminium, nickel, zinc, iron ore, uranium) are monthly.
History is limited to the main chart’s symbol. Use TVC:GOLD as the main chart for the longest data.
Grains and softs are quoted in cents, so ratio values are ×100. The shape and gaps are unaffected.
The S&P 500 preset is price only, excluding dividends. Use SP:SPXTR via Custom for total return.
Descriptive, not a timing signal.

Declinazione di responsabilità
Le informazioni e le pubblicazioni non sono intese come, e non costituiscono, consulenza o raccomandazioni finanziarie, di investimento, di trading o di altro tipo fornite o approvate da TradingView. Per ulteriori informazioni, consultare i Termini di utilizzo.
Declinazione di responsabilità
Le informazioni e le pubblicazioni non sono intese come, e non costituiscono, consulenza o raccomandazioni finanziarie, di investimento, di trading o di altro tipo fornite o approvate da TradingView. Per ulteriori informazioni, consultare i Termini di utilizzo.