The Clockface: is the day's high in yet
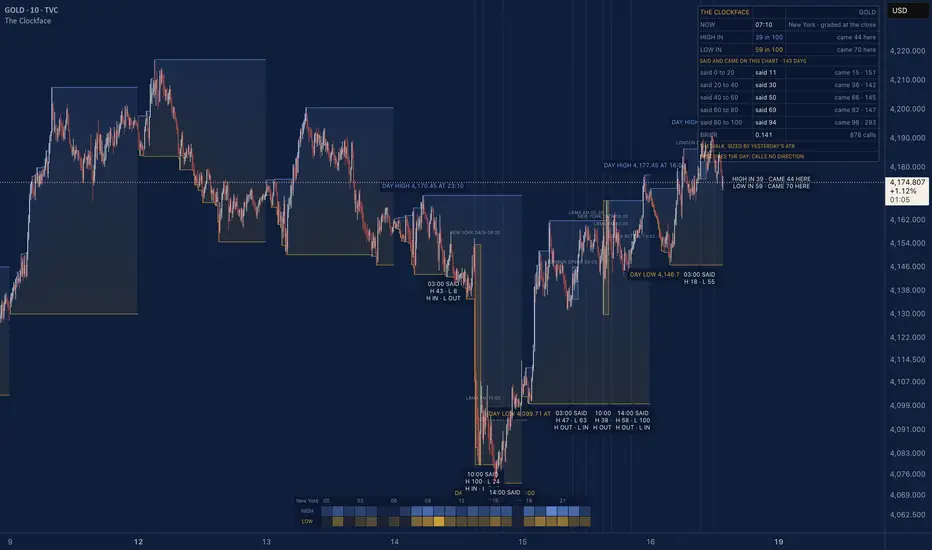
Is today's high already in? The low? The Clockface puts odds on both three times a day, grades every one at the day's close on the chart you load it on, and prints beside each how often odds like it came true on that chart.
HOW THE ODDS ARE MADE
A random walk, sized by yesterday's ATR and the hours left in the gold day. The day's spread is taken as ATR divided by 1.596, the ratio of a random walk's average daily range to its spread, and shrinks with the square root of the hours left. The further price sits from the day's high, and the less time is left, the higher the odds that the high is already in. The same for the low.
On gold that walk says too little in the middle: when it said 50, the high or low was already in 67 times in 100 on our chart. So the script never shows the walk's odds alone. Beside every call it prints what came on your chart at that level.
WHAT IS DRAWN
The day's high and low so far, stepped, each with its price and the time it was made, and the range between them shaded from the high (blue) to the low (gold). Three stamps a day, at 03:00, 10:00 and 14:00 New York: the odds the high (H) and the low (L) were already in. At the day's close each stamp gets its grade: H IN or H OUT, L IN or L OUT. At the live bar: HIGH IN and LOW IN with their odds, and CAME beside each, once that tenth of the scale has 20 graded calls on the chart. The desk's hours as dotted marks: London's open (08:00 London), the LBMA gold auctions (10:30 and 15:00 London), New York's data hour (08:30 New York) and the COMEX settle (13:30 New York). London's first hour and New York's first hour from the data, shaded. Along the bottom, a strip of 24 hours: where each of the last 60 days made its high (blue) and its low (gold).
THE PANEL
NOW, with HIGH IN and LOW IN and what came at those odds on this chart. SAID AND CAME ON THIS CHART: every stamp graded since the chart's first whole day, in five bands of what was said, each with its average said, what came, and how many calls. Never reset. BRIER: the average squared miss of every call, with the number of calls. Lower is closer.
WHAT WE MEASURED
On TVC:GOLD's 10 minute chart, 24 March to 7 October 2026, 137 whole days and 822 calls: said 11, came 13; said 30, came 36; said 50, came 67; said 69, came 82; said 94, came 95. Brier 0.136, against 0.226 for a flat guess at the overall rate. On a longer XAUUSD 15 minute history, 641 days from January 2024, the same walk said 50 and came 57. On both, the walk allowed for more travel than gold made.
The common rule of thumb asks how much of the average daily range is already used. We turned it into odds from gold's own past days, at the same three hours, and wrote the comparison down before running it. On the same 137 days the walk scored 0.136 against the rule's 0.199. Then we ran it once on palladium's 10 minute chart, a metal the script was never built or tested on: 125 days, 0.130 against 0.185. The walk leaned the same way there: said 50, came 58.
We also wrote down a walk run on gold's own clock, the hours sized by how much gold has moved in each, and tested it against this plain walk on that longer history before building. It did not beat it, so the plain walk ships with its miss printed beside it. Past counts describe the past only.
HOW TO USE IT
Read the odds against the clock: the same distance below the high counts for more at 14:00 than at 03:00, because less of the day is left. Read CAME before SAID. The heat strip shows which hours of your clock have been making the day's extremes lately. The script describes the day and calls no direction.
SETTINGS
Clock (New York): New York, London or Madrid, for the times written on the stamps, the desk's hours and the strip. Desk hours: on or off. Panel, ledger and heat strip: on or off. The lines and the shading can each be switched off in the Style tab.
Runs on intraday charts of 30 minutes or less that divide the half hour (1, 5, 10, 15 or 30 minutes, for example). Built on gold's day, 18:00 to 17:00 New York; on another symbol the walk and the ledger run on that symbol's daily bars. The stamps and grades print on closed bars; the live odds move with the price, as they should. Our own maths and code, written from scratch. Free and open source.
HOW THE ODDS ARE MADE
A random walk, sized by yesterday's ATR and the hours left in the gold day. The day's spread is taken as ATR divided by 1.596, the ratio of a random walk's average daily range to its spread, and shrinks with the square root of the hours left. The further price sits from the day's high, and the less time is left, the higher the odds that the high is already in. The same for the low.
On gold that walk says too little in the middle: when it said 50, the high or low was already in 67 times in 100 on our chart. So the script never shows the walk's odds alone. Beside every call it prints what came on your chart at that level.
WHAT IS DRAWN
The day's high and low so far, stepped, each with its price and the time it was made, and the range between them shaded from the high (blue) to the low (gold). Three stamps a day, at 03:00, 10:00 and 14:00 New York: the odds the high (H) and the low (L) were already in. At the day's close each stamp gets its grade: H IN or H OUT, L IN or L OUT. At the live bar: HIGH IN and LOW IN with their odds, and CAME beside each, once that tenth of the scale has 20 graded calls on the chart. The desk's hours as dotted marks: London's open (08:00 London), the LBMA gold auctions (10:30 and 15:00 London), New York's data hour (08:30 New York) and the COMEX settle (13:30 New York). London's first hour and New York's first hour from the data, shaded. Along the bottom, a strip of 24 hours: where each of the last 60 days made its high (blue) and its low (gold).
THE PANEL
NOW, with HIGH IN and LOW IN and what came at those odds on this chart. SAID AND CAME ON THIS CHART: every stamp graded since the chart's first whole day, in five bands of what was said, each with its average said, what came, and how many calls. Never reset. BRIER: the average squared miss of every call, with the number of calls. Lower is closer.
WHAT WE MEASURED
On TVC:GOLD's 10 minute chart, 24 March to 7 October 2026, 137 whole days and 822 calls: said 11, came 13; said 30, came 36; said 50, came 67; said 69, came 82; said 94, came 95. Brier 0.136, against 0.226 for a flat guess at the overall rate. On a longer XAUUSD 15 minute history, 641 days from January 2024, the same walk said 50 and came 57. On both, the walk allowed for more travel than gold made.
The common rule of thumb asks how much of the average daily range is already used. We turned it into odds from gold's own past days, at the same three hours, and wrote the comparison down before running it. On the same 137 days the walk scored 0.136 against the rule's 0.199. Then we ran it once on palladium's 10 minute chart, a metal the script was never built or tested on: 125 days, 0.130 against 0.185. The walk leaned the same way there: said 50, came 58.
We also wrote down a walk run on gold's own clock, the hours sized by how much gold has moved in each, and tested it against this plain walk on that longer history before building. It did not beat it, so the plain walk ships with its miss printed beside it. Past counts describe the past only.
HOW TO USE IT
Read the odds against the clock: the same distance below the high counts for more at 14:00 than at 03:00, because less of the day is left. Read CAME before SAID. The heat strip shows which hours of your clock have been making the day's extremes lately. The script describes the day and calls no direction.
SETTINGS
Clock (New York): New York, London or Madrid, for the times written on the stamps, the desk's hours and the strip. Desk hours: on or off. Panel, ledger and heat strip: on or off. The lines and the shading can each be switched off in the Style tab.
Runs on intraday charts of 30 minutes or less that divide the half hour (1, 5, 10, 15 or 30 minutes, for example). Built on gold's day, 18:00 to 17:00 New York; on another symbol the walk and the ledger run on that symbol's daily bars. The stamps and grades print on closed bars; the live odds move with the price, as they should. Our own maths and code, written from scratch. Free and open source.

The Fan: 7 days free, then €149.99/month. Cancel before day 7 and pay nothing.
Start the trial: thesimplifier7.com/method.html
The record, every miss kept: thesimplifier7.com
Questions: DM @TheSimplifier7 on X
Start the trial: thesimplifier7.com/method.html
The record, every miss kept: thesimplifier7.com
Questions: DM @TheSimplifier7 on X
Declinazione di responsabilità
Le informazioni e le pubblicazioni non sono intese come, e non costituiscono, consulenza o raccomandazioni finanziarie, di investimento, di trading o di altro tipo fornite o approvate da TradingView. Per ulteriori informazioni, consultare i Termini di utilizzo.
The Fan: 7 days free, then €149.99/month. Cancel before day 7 and pay nothing.
Start the trial: thesimplifier7.com/method.html
The record, every miss kept: thesimplifier7.com
Questions: DM @TheSimplifier7 on X
Start the trial: thesimplifier7.com/method.html
The record, every miss kept: thesimplifier7.com
Questions: DM @TheSimplifier7 on X
Declinazione di responsabilità
Le informazioni e le pubblicazioni non sono intese come, e non costituiscono, consulenza o raccomandazioni finanziarie, di investimento, di trading o di altro tipo fornite o approvate da TradingView. Per ulteriori informazioni, consultare i Termini di utilizzo.