Friday CRT Model | Sattam
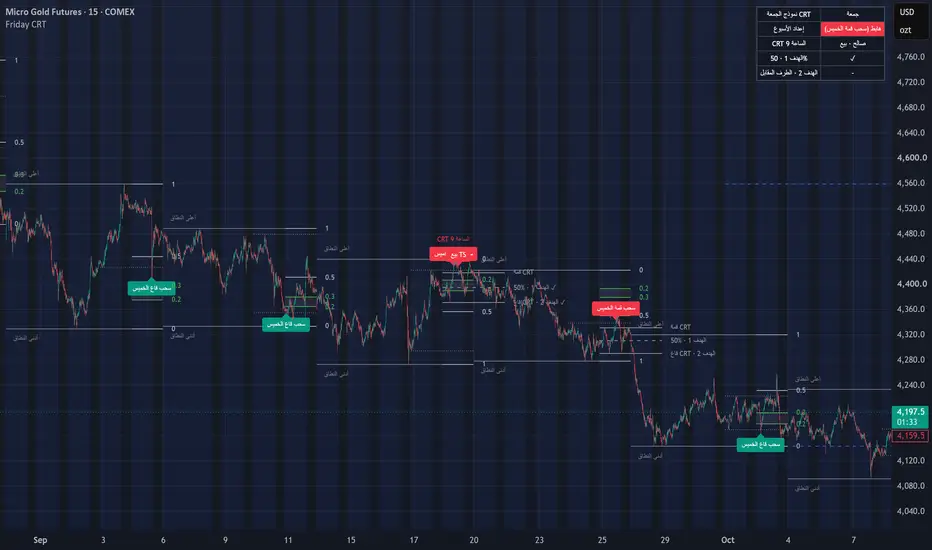
Friday CRT Model
OVERVIEW
This indicator automates a Friday trading workflow built on Candle Range Theory (CRT). It tracks the current weekly range, waits for Friday to take out Thursday's high or low, projects a Fibonacci grid over the weekly range in the direction of the expected retracement, and then looks for a 9 AM New York H4 CRT that agrees with that direction. It draws the CRT range, its 50% level and the opposite end as targets, and can mark a lower-timeframe entry. Each step depends on the previous one, so the chart only highlights setups where all steps line up.
HOW IT WORKS
1. Weekly range: Range High and Range Low are the highest high and lowest low of the current week, updated live.
2. Thursday purge: On Friday the script compares price with Thursday's high and low. It uses the trading day, so forex daily candles that open at 17:00 New York are handled correctly. If Friday trades above Thursday's high, the week is marked as a bearish setup (a retracement down into the range is expected). If Friday trades below Thursday's low, it is marked as a bullish setup. If Thursday is missing (holiday), the last trading day before Friday is used.
3. Weekly Fibonacci: Once the purge happens, a Fibonacci grid is drawn between the week's low and high. Level 0 is placed on the purged side, so the 0.2 and 0.3 levels (green, with a shaded zone) are measured from the weekly extreme back into the range. All levels and colours can be changed.
4. 9 AM H4 CRT: The script builds New York 4-hour blocks (01-05, 05-09, 09-13 and so on) from the chart's own candles, so "9 AM" always means 9 AM New York, whatever the broker's 4H candle alignment is. The 1 AM and 5 AM candles form the range (CRH, CRL and a dashed 50% line). The 9 AM candle must trade beyond one side of that range and close back inside it. A CRT is marked valid only when it forms on Friday, after the Thursday purge, and in the same direction as the weekly setup. CRTs that do not match can be hidden or shown dimmed. The 1 AM and 5 AM CRTs can also be enabled.
5. Targets: TP1 is the 50% of the CRT range. TP2 is the opposite end (CRL for sells, CRH for buys). A check mark is added to each target once price reaches it after the sweep.
6. TS entry (15m and lower): During the 9 AM candle, when price sweeps CRH (sell) or CRL (buy) and a candle then closes back inside the range, a TS marker is placed (a false-breakout, "turtle soup" style entry). Only one marker is placed per CRT.
7. Higher-timeframe context: Previous week and previous month high and low (PWH, PWL, PMH, PML), taken from completed higher-timeframe candles. Up to two manual KEY LEVEL zones (for example an order block) can be entered as price ranges.
8. Status table: Shows the day, the weekly setup, the CRT status (waiting, forming, valid, not valid) and whether TP1 and TP2 were reached.
HOW TO USE
- Start from your higher-timeframe bias (monthly / weekly) and your key levels. Enter them in the KEY LEVEL inputs if you want them on the chart.
- On Friday, on the Daily chart, watch for the Thursday purge label and the Fibonacci grid.
- Move to the 4H chart (or lower) and wait for the 9 AM CRT marker.
- Use the 15-minute chart for the TS marker, with the 50% line and the opposite end of the range as reference targets.
- Alerts are available for: Thursday purge, valid CRT, TS entry, TP1 reached and TP2 reached. The same events are also sent through "Any alert() function call" with the direction (buy / sell) in the message.
SETTINGS
- Chart language: English, Arabic, or both. All input names and tooltips are written in English and Arabic.
- Number of weeks kept on the chart, line extension, and colours and styles for every element.
- CRT timezone (default America/New_York), which CRT hours to use, number of range candles (default 2), how non-matching CRTs are shown, and how many trading days targets are followed.
- Every module can be switched on or off.
WHAT MAKES IT DIFFERENT
- The steps are linked: the Thursday purge sets the Fibonacci direction, and only CRTs that agree with that direction are highlighted, given targets and sent as alerts.
- The 4H blocks are built from New York session time instead of the broker's 4H candles, so the 9 AM candle is the same on forex, metals, indices and crypto.
- The CRT result is the same on 4H, 1H, 15m and 5m charts.
- The interface is fully bilingual (English and Arabic).
LIMITATIONS
- The model is built for Fridays. CRTs on other days are only shown when "Dim" is selected.
- The H4 CRT needs a chart of 4H or lower. On symbols whose 4H candles do not line up with New York 4H blocks (most crypto pairs), use 1H or lower. A warning appears on the chart otherwise.
- A CRT is confirmed one bar after the 9 AM candle closes. The purge, TS and target marks are placed on the bar where the condition happens and do not change after that bar closes. On the live, unclosed bar they can still change.
- The weekly range and Fibonacci levels update during the week and become final at the weekly close.
- Key levels are entered manually. The script does not detect order blocks.
- Only the last few weeks of drawings are kept (default 4) because of TradingView drawing limits.
- The TS marker is a simple sweep-and-close-back rule. It does not confirm market structure on its own.
DISCLAIMER
This script is a visual tool for studying price action. It is not financial advice, and past behaviour on the chart does not guarantee future results. Use your own analysis and risk management.
نموذج الجمعة CRT
نظرة عامة
يقوم هذا المؤشر بأتمتة أسلوب تداول خاص بيوم الجمعة مبني على نظرية نطاق الشمعة (CRT). يتابع المؤشر النطاق الأسبوعي الحالي، وينتظر أن يكسر يوم الجمعة قمة الخميس أو قاعه، ثم يرسم شبكة فيبوناتشي على النطاق الأسبوعي في اتجاه الارتداد المتوقع، وبعدها يبحث عن نموذج CRT على فريم 4 ساعات عند الساعة 9 صباحاً بتوقيت نيويورك يكون في نفس الاتجاه. يرسم المؤشر نطاق الـ CRT ومستوى 50% منه والطرف المقابل كأهداف، ويمكنه تحديد نقطة دخول على فريم أصغر. كل خطوة تعتمد على الخطوة التي قبلها، لذلك لا يبرز المؤشر إلا الفرص التي تتوافق فيها كل الخطوات.
طريقة العمل
1. النطاق الأسبوعي: أعلى النطاق وأدنى النطاق هما أعلى قمة وأدنى قاع في الأسبوع الحالي، ويتحدثان مباشرة.
2. سحب الخميس: يوم الجمعة يقارن المؤشر السعر بقمة الخميس وقاعه. يعتمد المؤشر على يوم التداول، لذلك يتعامل بشكل صحيح مع شموع الفوركس اليومية التي تبدأ الساعة 17:00 بتوقيت نيويورك. إذا تداول السعر يوم الجمعة فوق قمة الخميس يُعتبر الإعداد هابطاً (يُتوقع ارتداد للأسفل داخل النطاق)، وإذا تداول تحت قاع الخميس يُعتبر الإعداد صاعداً. إذا لم يوجد يوم خميس (عطلة) يُستخدم آخر يوم تداول قبل الجمعة.
3. فيبوناتشي الأسبوع: بعد حدوث السحب تُرسم شبكة فيبوناتشي بين قاع الأسبوع وقمته. يوضع المستوى 0 عند الطرف المسحوب، فتُقاس مستويات 0.2 و 0.3 (باللون الأخضر مع منطقة مظللة) من طرف الأسبوع إلى داخل النطاق. يمكن تعديل كل المستويات والألوان.
4. نموذج CRT الساعة 9 على فريم 4 ساعات: يبني المؤشر فترات 4 ساعات بتوقيت نيويورك (01-05، 05-09، 09-13 وهكذا) من شموع الشارت نفسها، لذلك تعني "الساعة 9" دائماً الساعة 9 صباحاً بتوقيت نيويورك مهما كانت طريقة الوسيط في ترتيب شموع الـ 4 ساعات. شمعتا الساعة 1 و 5 صباحاً تشكلان النطاق (قمة CRT وقاع CRT وخط 50% متقطع). يجب أن تتجاوز شمعة الساعة 9 أحد طرفي النطاق ثم تغلق داخله. لا يُعتبر الـ CRT صالحاً إلا إذا تكوّن يوم الجمعة، وبعد سحب الخميس، وفي نفس اتجاه إعداد الأسبوع. الـ CRT غير المطابق يمكن إخفاؤه أو إظهاره باهتاً. ويمكن أيضاً تفعيل CRT الساعة 1 والساعة 5.
5. الأهداف: الهدف الأول هو منتصف نطاق الـ CRT (50%). الهدف الثاني هو الطرف المقابل (قاع CRT في البيع، وقمة CRT في الشراء). تُضاف علامة صح لكل هدف عندما يصل إليه السعر بعد السحب.
6. دخول TS (فريم 15 دقيقة وأقل): أثناء شمعة الساعة 9، عندما يسحب السعر قمة CRT (بيع) أو قاعه (شراء) ثم تغلق شمعة داخل النطاق، توضع علامة TS (دخول على الاختراق الكاذب). توضع علامة واحدة فقط لكل CRT.
7. مستويات الفريم الأعلى: قمة وقاع الأسبوع السابق والشهر السابق (PWH و PWL و PMH و PML) من شموع مكتملة. ويمكن إدخال منطقتين يدويتين للمستويات الرئيسية (KEY LEVEL) مثل الأوردر بلوك على شكل نطاق سعري.
8. جدول الحالة: يعرض اليوم، وإعداد الأسبوع، وحالة الـ CRT (بالانتظار، قيد التكوين، صالح، غير صالح)، وهل تحقق الهدف الأول والثاني.
طريقة الاستخدام
- ابدأ من اتجاهك على الفريمات الكبيرة (شهري / أسبوعي) ومستوياتك الرئيسية، وأدخلها في خانات KEY LEVEL إذا أردت ظهورها على الشارت.
- يوم الجمعة، على الفريم اليومي، راقب علامة سحب الخميس وشبكة الفيبوناتشي.
- انتقل إلى فريم 4 ساعات (أو أقل) وانتظر علامة CRT الساعة 9.
- استخدم فريم 15 دقيقة لعلامة TS، مع خط 50% والطرف المقابل للنطاق كأهداف مرجعية.
- تتوفر تنبيهات لكل من: سحب الخميس، و CRT صالح، ودخول TS، وتحقق الهدف الأول، وتحقق الهدف الثاني. وتُرسل نفس الأحداث أيضاً عبر "Any alert() function call" مع ذكر الاتجاه (شراء / بيع) في الرسالة.
الإعدادات
- لغة الشارت: الإنجليزية أو العربية أو الاثنتان. كل أسماء الإعدادات والشروحات مكتوبة بالإنجليزية والعربية.
- عدد الأسابيع المعروضة، وتمديد الخطوط، والألوان والأنماط لكل عنصر.
- المنطقة الزمنية للـ CRT (الافتراضي America/New_York)، وساعات الـ CRT المستخدمة، وعدد شموع النطاق (الافتراضي 2)، وطريقة عرض الـ CRT غير المطابق، وعدد أيام التداول لمتابعة الأهداف.
- يمكن تشغيل أو إيقاف كل جزء من المؤشر.
ما الذي يميزه
- الخطوات مرتبطة ببعضها: سحب الخميس يحدد اتجاه الفيبوناتشي، ولا يُبرز إلا الـ CRT الموافق لهذا الاتجاه، ولا تُرسم الأهداف والتنبيهات إلا له.
- فترات الـ 4 ساعات مبنية على توقيت جلسة نيويورك وليس على شموع الوسيط، لذلك شمعة الساعة 9 هي نفسها في الفوركس والمعادن والمؤشرات والكريبتو.
- نتيجة الـ CRT هي نفسها على فريم 4 ساعات وساعة و15 دقيقة و5 دقائق.
- الواجهة بالكامل بلغتين (الإنجليزية والعربية).
القيود
- النموذج مصمم ليوم الجمعة. الـ CRT في الأيام الأخرى لا يظهر إلا عند اختيار "باهت".
- نموذج CRT يحتاج فريم 4 ساعات أو أقل. في الرموز التي لا تتوافق شموع الـ 4 ساعات فيها مع فترات نيويورك (أغلب أزواج الكريبتو) استخدم فريم ساعة أو أقل، وإلا ستظهر رسالة تنبيه على الشارت.
- يتأكد الـ CRT بعد إغلاق شمعة الساعة 9 بشمعة واحدة. علامات السحب و TS والأهداف توضع على الشمعة التي يتحقق فيها الشرط ولا تتغير بعد إغلاقها، لكنها قد تتغير على الشمعة الحالية قبل إغلاقها.
- النطاق الأسبوعي ومستويات الفيبوناتشي تتحدث خلال الأسبوع وتصبح نهائية عند إغلاق الأسبوع.
- المستويات الرئيسية تُدخل يدوياً، والمؤشر لا يكتشف الأوردر بلوك تلقائياً.
- يحتفظ المؤشر برسومات آخر عدة أسابيع فقط (الافتراضي 4) بسبب حدود الرسم في TradingView.
- علامة TS قاعدة بسيطة (سحب ثم إغلاق داخل النطاق)، ولا تؤكد هيكل السوق وحدها.
إخلاء مسؤولية
هذا المؤشر أداة بصرية لدراسة حركة السعر، وليس نصيحة مالية، والأداء السابق على الشارت لا يضمن النتائج المستقبلية. اعتمد على تحليلك الخاص وإدارة المخاطر.
OVERVIEW
This indicator automates a Friday trading workflow built on Candle Range Theory (CRT). It tracks the current weekly range, waits for Friday to take out Thursday's high or low, projects a Fibonacci grid over the weekly range in the direction of the expected retracement, and then looks for a 9 AM New York H4 CRT that agrees with that direction. It draws the CRT range, its 50% level and the opposite end as targets, and can mark a lower-timeframe entry. Each step depends on the previous one, so the chart only highlights setups where all steps line up.
HOW IT WORKS
1. Weekly range: Range High and Range Low are the highest high and lowest low of the current week, updated live.
2. Thursday purge: On Friday the script compares price with Thursday's high and low. It uses the trading day, so forex daily candles that open at 17:00 New York are handled correctly. If Friday trades above Thursday's high, the week is marked as a bearish setup (a retracement down into the range is expected). If Friday trades below Thursday's low, it is marked as a bullish setup. If Thursday is missing (holiday), the last trading day before Friday is used.
3. Weekly Fibonacci: Once the purge happens, a Fibonacci grid is drawn between the week's low and high. Level 0 is placed on the purged side, so the 0.2 and 0.3 levels (green, with a shaded zone) are measured from the weekly extreme back into the range. All levels and colours can be changed.
4. 9 AM H4 CRT: The script builds New York 4-hour blocks (01-05, 05-09, 09-13 and so on) from the chart's own candles, so "9 AM" always means 9 AM New York, whatever the broker's 4H candle alignment is. The 1 AM and 5 AM candles form the range (CRH, CRL and a dashed 50% line). The 9 AM candle must trade beyond one side of that range and close back inside it. A CRT is marked valid only when it forms on Friday, after the Thursday purge, and in the same direction as the weekly setup. CRTs that do not match can be hidden or shown dimmed. The 1 AM and 5 AM CRTs can also be enabled.
5. Targets: TP1 is the 50% of the CRT range. TP2 is the opposite end (CRL for sells, CRH for buys). A check mark is added to each target once price reaches it after the sweep.
6. TS entry (15m and lower): During the 9 AM candle, when price sweeps CRH (sell) or CRL (buy) and a candle then closes back inside the range, a TS marker is placed (a false-breakout, "turtle soup" style entry). Only one marker is placed per CRT.
7. Higher-timeframe context: Previous week and previous month high and low (PWH, PWL, PMH, PML), taken from completed higher-timeframe candles. Up to two manual KEY LEVEL zones (for example an order block) can be entered as price ranges.
8. Status table: Shows the day, the weekly setup, the CRT status (waiting, forming, valid, not valid) and whether TP1 and TP2 were reached.
HOW TO USE
- Start from your higher-timeframe bias (monthly / weekly) and your key levels. Enter them in the KEY LEVEL inputs if you want them on the chart.
- On Friday, on the Daily chart, watch for the Thursday purge label and the Fibonacci grid.
- Move to the 4H chart (or lower) and wait for the 9 AM CRT marker.
- Use the 15-minute chart for the TS marker, with the 50% line and the opposite end of the range as reference targets.
- Alerts are available for: Thursday purge, valid CRT, TS entry, TP1 reached and TP2 reached. The same events are also sent through "Any alert() function call" with the direction (buy / sell) in the message.
SETTINGS
- Chart language: English, Arabic, or both. All input names and tooltips are written in English and Arabic.
- Number of weeks kept on the chart, line extension, and colours and styles for every element.
- CRT timezone (default America/New_York), which CRT hours to use, number of range candles (default 2), how non-matching CRTs are shown, and how many trading days targets are followed.
- Every module can be switched on or off.
WHAT MAKES IT DIFFERENT
- The steps are linked: the Thursday purge sets the Fibonacci direction, and only CRTs that agree with that direction are highlighted, given targets and sent as alerts.
- The 4H blocks are built from New York session time instead of the broker's 4H candles, so the 9 AM candle is the same on forex, metals, indices and crypto.
- The CRT result is the same on 4H, 1H, 15m and 5m charts.
- The interface is fully bilingual (English and Arabic).
LIMITATIONS
- The model is built for Fridays. CRTs on other days are only shown when "Dim" is selected.
- The H4 CRT needs a chart of 4H or lower. On symbols whose 4H candles do not line up with New York 4H blocks (most crypto pairs), use 1H or lower. A warning appears on the chart otherwise.
- A CRT is confirmed one bar after the 9 AM candle closes. The purge, TS and target marks are placed on the bar where the condition happens and do not change after that bar closes. On the live, unclosed bar they can still change.
- The weekly range and Fibonacci levels update during the week and become final at the weekly close.
- Key levels are entered manually. The script does not detect order blocks.
- Only the last few weeks of drawings are kept (default 4) because of TradingView drawing limits.
- The TS marker is a simple sweep-and-close-back rule. It does not confirm market structure on its own.
DISCLAIMER
This script is a visual tool for studying price action. It is not financial advice, and past behaviour on the chart does not guarantee future results. Use your own analysis and risk management.
نموذج الجمعة CRT
نظرة عامة
يقوم هذا المؤشر بأتمتة أسلوب تداول خاص بيوم الجمعة مبني على نظرية نطاق الشمعة (CRT). يتابع المؤشر النطاق الأسبوعي الحالي، وينتظر أن يكسر يوم الجمعة قمة الخميس أو قاعه، ثم يرسم شبكة فيبوناتشي على النطاق الأسبوعي في اتجاه الارتداد المتوقع، وبعدها يبحث عن نموذج CRT على فريم 4 ساعات عند الساعة 9 صباحاً بتوقيت نيويورك يكون في نفس الاتجاه. يرسم المؤشر نطاق الـ CRT ومستوى 50% منه والطرف المقابل كأهداف، ويمكنه تحديد نقطة دخول على فريم أصغر. كل خطوة تعتمد على الخطوة التي قبلها، لذلك لا يبرز المؤشر إلا الفرص التي تتوافق فيها كل الخطوات.
طريقة العمل
1. النطاق الأسبوعي: أعلى النطاق وأدنى النطاق هما أعلى قمة وأدنى قاع في الأسبوع الحالي، ويتحدثان مباشرة.
2. سحب الخميس: يوم الجمعة يقارن المؤشر السعر بقمة الخميس وقاعه. يعتمد المؤشر على يوم التداول، لذلك يتعامل بشكل صحيح مع شموع الفوركس اليومية التي تبدأ الساعة 17:00 بتوقيت نيويورك. إذا تداول السعر يوم الجمعة فوق قمة الخميس يُعتبر الإعداد هابطاً (يُتوقع ارتداد للأسفل داخل النطاق)، وإذا تداول تحت قاع الخميس يُعتبر الإعداد صاعداً. إذا لم يوجد يوم خميس (عطلة) يُستخدم آخر يوم تداول قبل الجمعة.
3. فيبوناتشي الأسبوع: بعد حدوث السحب تُرسم شبكة فيبوناتشي بين قاع الأسبوع وقمته. يوضع المستوى 0 عند الطرف المسحوب، فتُقاس مستويات 0.2 و 0.3 (باللون الأخضر مع منطقة مظللة) من طرف الأسبوع إلى داخل النطاق. يمكن تعديل كل المستويات والألوان.
4. نموذج CRT الساعة 9 على فريم 4 ساعات: يبني المؤشر فترات 4 ساعات بتوقيت نيويورك (01-05، 05-09، 09-13 وهكذا) من شموع الشارت نفسها، لذلك تعني "الساعة 9" دائماً الساعة 9 صباحاً بتوقيت نيويورك مهما كانت طريقة الوسيط في ترتيب شموع الـ 4 ساعات. شمعتا الساعة 1 و 5 صباحاً تشكلان النطاق (قمة CRT وقاع CRT وخط 50% متقطع). يجب أن تتجاوز شمعة الساعة 9 أحد طرفي النطاق ثم تغلق داخله. لا يُعتبر الـ CRT صالحاً إلا إذا تكوّن يوم الجمعة، وبعد سحب الخميس، وفي نفس اتجاه إعداد الأسبوع. الـ CRT غير المطابق يمكن إخفاؤه أو إظهاره باهتاً. ويمكن أيضاً تفعيل CRT الساعة 1 والساعة 5.
5. الأهداف: الهدف الأول هو منتصف نطاق الـ CRT (50%). الهدف الثاني هو الطرف المقابل (قاع CRT في البيع، وقمة CRT في الشراء). تُضاف علامة صح لكل هدف عندما يصل إليه السعر بعد السحب.
6. دخول TS (فريم 15 دقيقة وأقل): أثناء شمعة الساعة 9، عندما يسحب السعر قمة CRT (بيع) أو قاعه (شراء) ثم تغلق شمعة داخل النطاق، توضع علامة TS (دخول على الاختراق الكاذب). توضع علامة واحدة فقط لكل CRT.
7. مستويات الفريم الأعلى: قمة وقاع الأسبوع السابق والشهر السابق (PWH و PWL و PMH و PML) من شموع مكتملة. ويمكن إدخال منطقتين يدويتين للمستويات الرئيسية (KEY LEVEL) مثل الأوردر بلوك على شكل نطاق سعري.
8. جدول الحالة: يعرض اليوم، وإعداد الأسبوع، وحالة الـ CRT (بالانتظار، قيد التكوين، صالح، غير صالح)، وهل تحقق الهدف الأول والثاني.
طريقة الاستخدام
- ابدأ من اتجاهك على الفريمات الكبيرة (شهري / أسبوعي) ومستوياتك الرئيسية، وأدخلها في خانات KEY LEVEL إذا أردت ظهورها على الشارت.
- يوم الجمعة، على الفريم اليومي، راقب علامة سحب الخميس وشبكة الفيبوناتشي.
- انتقل إلى فريم 4 ساعات (أو أقل) وانتظر علامة CRT الساعة 9.
- استخدم فريم 15 دقيقة لعلامة TS، مع خط 50% والطرف المقابل للنطاق كأهداف مرجعية.
- تتوفر تنبيهات لكل من: سحب الخميس، و CRT صالح، ودخول TS، وتحقق الهدف الأول، وتحقق الهدف الثاني. وتُرسل نفس الأحداث أيضاً عبر "Any alert() function call" مع ذكر الاتجاه (شراء / بيع) في الرسالة.
الإعدادات
- لغة الشارت: الإنجليزية أو العربية أو الاثنتان. كل أسماء الإعدادات والشروحات مكتوبة بالإنجليزية والعربية.
- عدد الأسابيع المعروضة، وتمديد الخطوط، والألوان والأنماط لكل عنصر.
- المنطقة الزمنية للـ CRT (الافتراضي America/New_York)، وساعات الـ CRT المستخدمة، وعدد شموع النطاق (الافتراضي 2)، وطريقة عرض الـ CRT غير المطابق، وعدد أيام التداول لمتابعة الأهداف.
- يمكن تشغيل أو إيقاف كل جزء من المؤشر.
ما الذي يميزه
- الخطوات مرتبطة ببعضها: سحب الخميس يحدد اتجاه الفيبوناتشي، ولا يُبرز إلا الـ CRT الموافق لهذا الاتجاه، ولا تُرسم الأهداف والتنبيهات إلا له.
- فترات الـ 4 ساعات مبنية على توقيت جلسة نيويورك وليس على شموع الوسيط، لذلك شمعة الساعة 9 هي نفسها في الفوركس والمعادن والمؤشرات والكريبتو.
- نتيجة الـ CRT هي نفسها على فريم 4 ساعات وساعة و15 دقيقة و5 دقائق.
- الواجهة بالكامل بلغتين (الإنجليزية والعربية).
القيود
- النموذج مصمم ليوم الجمعة. الـ CRT في الأيام الأخرى لا يظهر إلا عند اختيار "باهت".
- نموذج CRT يحتاج فريم 4 ساعات أو أقل. في الرموز التي لا تتوافق شموع الـ 4 ساعات فيها مع فترات نيويورك (أغلب أزواج الكريبتو) استخدم فريم ساعة أو أقل، وإلا ستظهر رسالة تنبيه على الشارت.
- يتأكد الـ CRT بعد إغلاق شمعة الساعة 9 بشمعة واحدة. علامات السحب و TS والأهداف توضع على الشمعة التي يتحقق فيها الشرط ولا تتغير بعد إغلاقها، لكنها قد تتغير على الشمعة الحالية قبل إغلاقها.
- النطاق الأسبوعي ومستويات الفيبوناتشي تتحدث خلال الأسبوع وتصبح نهائية عند إغلاق الأسبوع.
- المستويات الرئيسية تُدخل يدوياً، والمؤشر لا يكتشف الأوردر بلوك تلقائياً.
- يحتفظ المؤشر برسومات آخر عدة أسابيع فقط (الافتراضي 4) بسبب حدود الرسم في TradingView.
- علامة TS قاعدة بسيطة (سحب ثم إغلاق داخل النطاق)، ولا تؤكد هيكل السوق وحدها.
إخلاء مسؤولية
هذا المؤشر أداة بصرية لدراسة حركة السعر، وليس نصيحة مالية، والأداء السابق على الشارت لا يضمن النتائج المستقبلية. اعتمد على تحليلك الخاص وإدارة المخاطر.

Declinazione di responsabilità
Le informazioni e le pubblicazioni non sono intese come, e non costituiscono, consulenza o raccomandazioni finanziarie, di investimento, di trading o di altro tipo fornite o approvate da TradingView. Per ulteriori informazioni, consultare i Termini di utilizzo.
Declinazione di responsabilità
Le informazioni e le pubblicazioni non sono intese come, e non costituiscono, consulenza o raccomandazioni finanziarie, di investimento, di trading o di altro tipo fornite o approvate da TradingView. Per ulteriori informazioni, consultare i Termini di utilizzo.