Aggiornato
AntiVestor - Top 'n Tail Zones
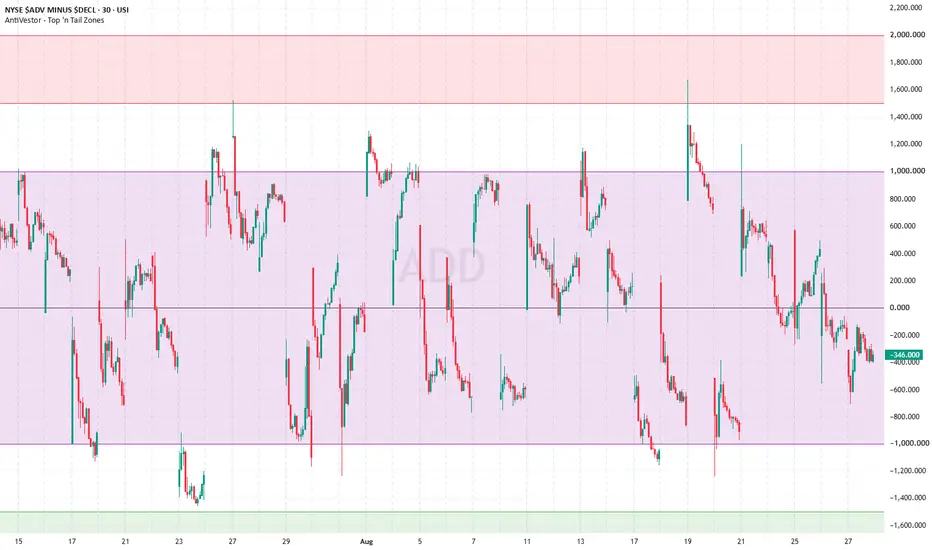
AntiVestor - Top 'n Tail Zones
Top 'n Tail Zones is a utility for marking fixed levels and shaded zones on any chart or pane that moves on a stable numeric scale — market breadth readings, percentage-above-moving-average lines, or any bounded oscillator. It tops and tails the range: an upper extreme zone, a lower extreme zone, and a neutral middle, all set by you.
You pick a scale preset or enter the levels yourself; it paints the zones, three reference lines and four labels, and holds them across the chart.
It calculates nothing. There is no signal, no reading of price, no alert. Every level on screen is a number you chose.


WHAT IT DRAWS
All levels and all six colours are adjustable. The zones extend back to the first loaded bar and forward by a configurable number of bars.
WHAT IT IS FOR
Anything that oscillates inside a range you already know the shape of:
The intended pattern is a top zone, a bottom zone and a neutral middle, so that a glance tells you which part of the range you are in.
HOW TO APPLY IT
Two routes, depending on what you are zoning.
1. Chart the instrument directly and add the script. It draws on that instrument's own scale.
2. Add the script, then drag it into the pane of the oscillator you want to zone. It picks up that pane's scale.
Then pick a preset.
ADD / Breadth sets levels suited to an advance-decline reading in the low thousands.
Percentage (0-100) sets the top and bottom tenth as the extreme zones and marks 50 as the midpoint — for percentage-above-moving-average readings and bounded oscillators.
Custom hands control to the six level inputs, which is where you go for any scale the two presets do not fit.
A NOTE ON THE DEFAULT COLOURS
The upper zone defaults to red and the lower to green, which is the opposite of what you might expect. That is deliberate: on a mean-reversion scale the top of the range is where you become cautious, not enthusiastic. If you read the scale the other way, both are colour inputs.
LIMITATIONS
Nothing here adapts. The presets are fixed sets of numbers and the custom levels are static. Nothing recalculates, rescales or follows the instrument — change scale and you change the preset or re-enter the levels yourself.
Zones begin at the first bar loaded in your chart's history, not at the true start of the instrument.
The zone labels are fixed text. "Bullish Extreme" and "Bearish Extreme" will not match every scale you might apply this to.
No alerts, no signals, no directional output of any kind. Because nothing is computed from price, nothing repaints, but equally nothing is confirmed either.
On a standard price chart the preset levels are far from price and the zones will be invisible. That is expected — switch to Custom and enter levels that suit the instrument.
This is a drawing utility, not an analysis tool. It does not tell you anything you did not already decide. Nothing here is financial advice.
Top 'n Tail Zones is a utility for marking fixed levels and shaded zones on any chart or pane that moves on a stable numeric scale — market breadth readings, percentage-above-moving-average lines, or any bounded oscillator. It tops and tails the range: an upper extreme zone, a lower extreme zone, and a neutral middle, all set by you.
You pick a scale preset or enter the levels yourself; it paints the zones, three reference lines and four labels, and holds them across the chart.
It calculates nothing. There is no signal, no reading of price, no alert. Every level on screen is a number you chose.
WHAT IT DRAWS
- An upper zone, bounded by two levels. Labelled "Bullish Extreme" by default.
- A lower zone, labelled "Bearish Extreme".
- A middle zone between an upper and lower boundary, labelled as the neutral or chop area. If you set its upper and lower bounds to the same number, it collapses to a single midpoint line rather than a zero-height box.
- Dashed reference lines at the middle-zone boundaries, and an optional solid line at zero.
- Four labels floating to the right of the last bar, so the zones stay identified when you are scrolled in.
All levels and all six colours are adjustable. The zones extend back to the first loaded bar and forward by a configurable number of bars.
WHAT IT IS FOR
Anything that oscillates inside a range you already know the shape of:
- Market breadth symbols such as advance-decline differences, where the useful information is how far into an extreme the reading has gone rather than the number itself.
- Percentage-of-stocks-above-moving-average readings, which live on a 0-100 scale where the top and bottom bands are the interesting parts.
- Any bounded oscillator, where you want a shaded band rather than a pair of thin lines.
The intended pattern is a top zone, a bottom zone and a neutral middle, so that a glance tells you which part of the range you are in.
HOW TO APPLY IT
Two routes, depending on what you are zoning.
1. Chart the instrument directly and add the script. It draws on that instrument's own scale.
2. Add the script, then drag it into the pane of the oscillator you want to zone. It picks up that pane's scale.
Then pick a preset.
ADD / Breadth sets levels suited to an advance-decline reading in the low thousands.
Percentage (0-100) sets the top and bottom tenth as the extreme zones and marks 50 as the midpoint — for percentage-above-moving-average readings and bounded oscillators.
Custom hands control to the six level inputs, which is where you go for any scale the two presets do not fit.
A NOTE ON THE DEFAULT COLOURS
The upper zone defaults to red and the lower to green, which is the opposite of what you might expect. That is deliberate: on a mean-reversion scale the top of the range is where you become cautious, not enthusiastic. If you read the scale the other way, both are colour inputs.
LIMITATIONS
Nothing here adapts. The presets are fixed sets of numbers and the custom levels are static. Nothing recalculates, rescales or follows the instrument — change scale and you change the preset or re-enter the levels yourself.
Zones begin at the first bar loaded in your chart's history, not at the true start of the instrument.
The zone labels are fixed text. "Bullish Extreme" and "Bearish Extreme" will not match every scale you might apply this to.
No alerts, no signals, no directional output of any kind. Because nothing is computed from price, nothing repaints, but equally nothing is confirmed either.
On a standard price chart the preset levels are far from price and the zones will be invisible. That is expected — switch to Custom and enter levels that suit the instrument.
This is a drawing utility, not an analysis tool. It does not tell you anything you did not already decide. Nothing here is financial advice.
Note di rilascio
Runtime Error Fix
Full-time trader and mentor since 2001
Focusing on short term income swings with $SPX options, futures and occasionally stocks.
Focusing on short term income swings with $SPX options, futures and occasionally stocks.
Declinazione di responsabilità
Le informazioni e le pubblicazioni non sono intese come, e non costituiscono, consulenza o raccomandazioni finanziarie, di investimento, di trading o di altro tipo fornite o approvate da TradingView. Per ulteriori informazioni, consultare i Termini di utilizzo.
Full-time trader and mentor since 2001
Focusing on short term income swings with $SPX options, futures and occasionally stocks.
Focusing on short term income swings with $SPX options, futures and occasionally stocks.
Declinazione di responsabilità
Le informazioni e le pubblicazioni non sono intese come, e non costituiscono, consulenza o raccomandazioni finanziarie, di investimento, di trading o di altro tipo fornite o approvate da TradingView. Per ulteriori informazioni, consultare i Termini di utilizzo.