OPEN-SOURCE SCRIPT
Aggiornato Oversold Master
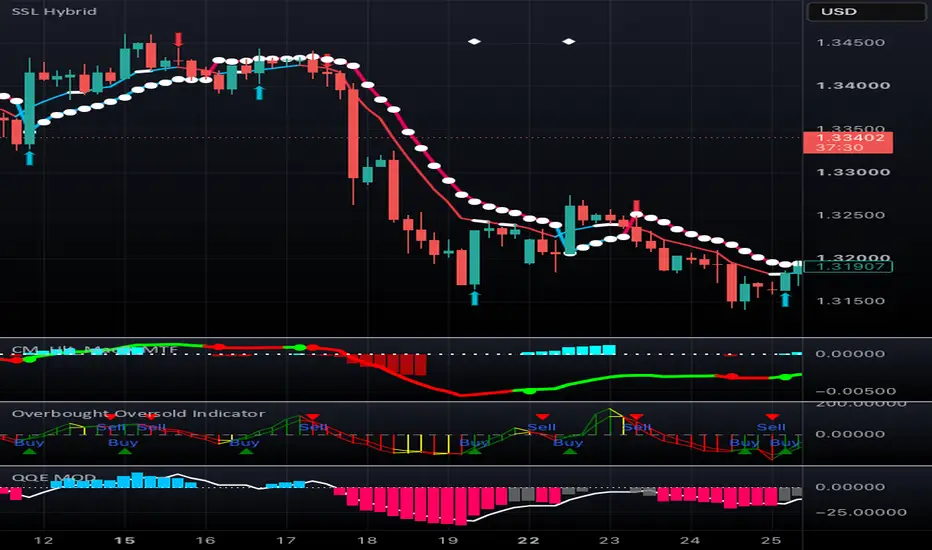
How it works, and how to tune it:
Gray line = neutral. Red = in overbought zone. Blue = in oversold zone.
A triangle signal only appears after price has confirmed its way back out of the zone (controlled by "Bars to Confirm Exit From Zone") — this is what prevents you from selling into a strong momentum spike that keeps climbing.
The bands themselves move (adaptive mode) — during high volatility they widen, so you don't get an overbought signal every 20 minutes; during quiet chop they tighten, so you still catch real extremes.
The trend filter checks a daily EMA by default — it will block sell signals while the daily trend is up, and block buy signals while the daily trend is down. This is the setting most responsible for avoiding "buying a dip that's actually the start of a crash."
Gray line = neutral. Red = in overbought zone. Blue = in oversold zone.
A triangle signal only appears after price has confirmed its way back out of the zone (controlled by "Bars to Confirm Exit From Zone") — this is what prevents you from selling into a strong momentum spike that keeps climbing.
The bands themselves move (adaptive mode) — during high volatility they widen, so you don't get an overbought signal every 20 minutes; during quiet chop they tighten, so you still catch real extremes.
The trend filter checks a daily EMA by default — it will block sell signals while the daily trend is up, and block buy signals while the daily trend is down. This is the setting most responsible for avoiding "buying a dip that's actually the start of a crash."
Note di rilascio
How it works, and how to tune it:Gray line = neutral. Red = in overbought zone. Blue = in oversold zone.
A triangle signal only appears after price has confirmed its way back out of the zone (controlled by "Bars to Confirm Exit From Zone") — this is what prevents you from selling into a strong momentum spike that keeps climbing.
The bands themselves move (adaptive mode) — during high volatility they widen, so you don't get an overbought signal every 20 minutes; during quiet chop they tighten, so you still catch real extremes.
The trend filter checks a daily EMA by default — it will block sell signals while the daily trend is up, and block buy signals while the daily trend is down. This is the setting most responsible for avoiding "buying a dip that's actually the start of a crash."
Script open-source
Nello spirito di TradingView, l'autore di questo script lo ha reso open source, in modo che i trader possano esaminarne e verificarne la funzionalità. Complimenti all'autore! Sebbene sia possibile utilizzarlo gratuitamente, ricordiamo che la ripubblicazione del codice è soggetta al nostro Regolamento.

Declinazione di responsabilità
Le informazioni e le pubblicazioni non sono intese come, e non costituiscono, consulenza o raccomandazioni finanziarie, di investimento, di trading o di altro tipo fornite o approvate da TradingView. Per ulteriori informazioni, consultare i Termini di utilizzo.
Script open-source
Nello spirito di TradingView, l'autore di questo script lo ha reso open source, in modo che i trader possano esaminarne e verificarne la funzionalità. Complimenti all'autore! Sebbene sia possibile utilizzarlo gratuitamente, ricordiamo che la ripubblicazione del codice è soggetta al nostro Regolamento.
Declinazione di responsabilità
Le informazioni e le pubblicazioni non sono intese come, e non costituiscono, consulenza o raccomandazioni finanziarie, di investimento, di trading o di altro tipo fornite o approvate da TradingView. Per ulteriori informazioni, consultare i Termini di utilizzo.