OPEN-SOURCE SCRIPT
Aggiornato Camarilla Pivot Points
### Overview
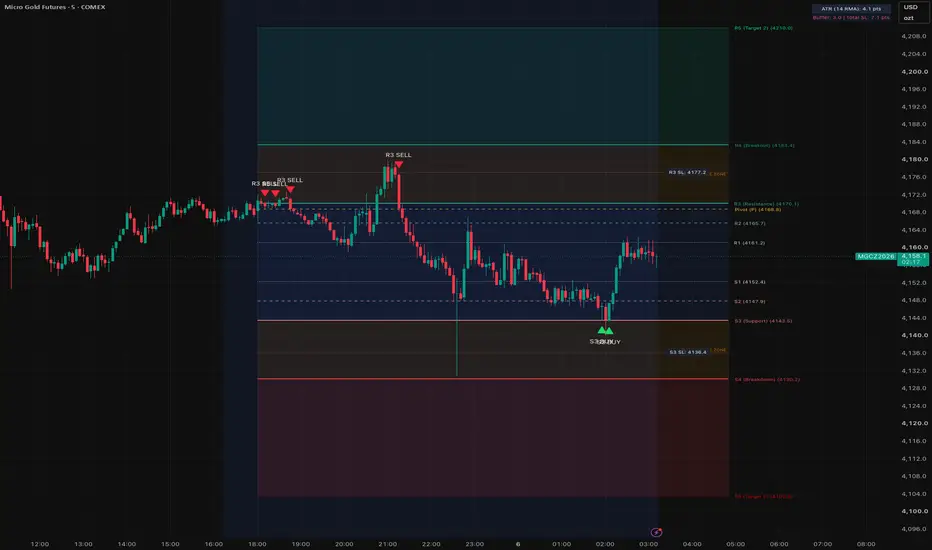
Camarilla Pivot Points is an institutional-grade technical analysis indicator designed to project key intraday and swing support, resistance, and volatility expansion zones. Based on the mathematical framework introduced by Nick Stott in 1989, Camarilla pivots utilize the prior period's high, low, and close to establish statistically significant equilibrium and expansion thresholds.
Unlike traditional floor pivots, Camarilla levels place heavy emphasis on mean reversion within the central range while clearly distinguishing the boundary where explosive directional momentum begins.
This implementation features non-repainting higher timeframe data feeds, institutional zone shading, dedicated no-trade buffer zones, customizable display modes (projected active vs. full historical stepped lines), and optional real-time signal markers.
### Core Philosophy & Market Mechanics
Statistical market research demonstrates that asset prices spend approximately 75% to 80% of trading sessions consolidating within the central dealing range. Camarilla pivots capitalize on this structure by dividing the market into three distinct behavioral regimes:
1. Range Equilibrium (Mean Reversion Regime)
The space between Support 3 (S3) and Resistance 3 (R3) represents the core dealing range. When the market opens or trades within this band, institutional algorithms frequently fade extremes, targeting a return to the opposite level or the Central Pivot (P).
2. The Buffer Zone (No-Trade Regime)
The zones between R3 to R4 and S3 to S4 represent transitionary buffers. In these bands, mean reversion has failed to resolve immediately, but a structural breakout has not yet occurred. Trading within these zones exposes market participants to unfavorable risk-to-reward ratios and false breakouts (whipsaws). This indicator explicitly highlights these buffer areas as designated "No-Trade Zones."
3. Directional Momentum (Breakout Regime)
A sustained breach and candle close outside R4 (bullish) or S4 (bearish) signals institutional accumulation or distribution. Once price escapes the buffer zone, mean-reversion trading is invalidated, and directional trend-following rules take effect toward R5 and S5.
### Mathematical Framework
All calculations are derived from the prior completed higher timeframe bar (High, Low, Close) and the prevailing range (High - Low):
* Pivot Point (P) = (High + Low + Close) / 3
* R5 (Max Bullish Expansion / Target 2) = Close + Range * 1.1000
* R4 (Bullish Breakout Trigger) = Close + Range * 0.5500
* R3 (Primary Resistance / Mean Reversion) = Close + Range * 0.2750
* R2 (Intermediate Upper Buffer) = Close + Range * 0.1833
* R1 (Minor Upper Buffer) = Close + Range * 0.0916
* S1 (Minor Lower Buffer) = Close - Range * 0.0916
* S2 (Intermediate Lower Buffer) = Close - Range * 0.1833
* S3 (Primary Support / Mean Reversion) = Close - Range * 0.2750
* S4 (Bearish Breakdown Trigger) = Close - Range * 0.5500
* S5 (Max Bearish Expansion / Target 2) = Close - Range * 1.1000
### How to Trade with Camarilla Pivot Points
#### 1. Mean Reversion Setup (Inside-Out)
* Bias: Neutral to Range-Bound.
* Long Entry: Price dips to or sweeps S3, rejects lower prices, and closes back above S3.
* Short Entry: Price rallies to or tests R3, rejects higher prices, and closes back below R3.
* Take Profit: Central Pivot (P), opposite pivot boundary (S3 -> R3, or R3 -> S3).
* Stop Loss: Beyond the respective buffer zone (below S4 for longs, above R4 for shorts).
#### 2. The No-Trade Rule (Buffer Zones)
* Region: Between R3 and R4 (Upper Buffer) and between S3 and S4 (Lower Buffer).
* Rule: Avoid initiating new positions inside these bands. Wait for either a confirmed rejection back into the range (mean reversion) or a confirmed close beyond R4/S4 (trend breakout).
#### 3. Trend Breakout Setup (Expansion Runners)
* Bias: Strong Momentum / Trend-Following.
* Bullish Breakout: A candle closes cleanly above R4 with strong volume. Target: R5.
* Bearish Breakdown: A candle closes cleanly below S4 with strong volume. Target: S5.
* Stop Loss: Inside the buffer zone (below R3 for longs, above S3 for shorts).
### Visual & Structural Features
* Clean Active Projections: Extends clean, clutter-free horizontal lines into the future with dynamic price and level tags.
* Full Historical Stepped Lines: View unbroken multi-day or multi-week historical performance across the entire chart.
* Institutional Shaded Boxes:
- Range Equilibrium: Semi-transparent blue fill between S3 and R3.
- Buffer / No-Trade Zones: Caution amber fill between R3-R4 and S3-S4 with right-aligned badges.
- Bullish Expansion: Emerald green fill between R4 and R5.
- Bearish Expansion: Coral red fill between S4 and S5.
* Real-Time Signal Markers: Optional visual cues plotted on confirmed candle closes for S3 bounces, R3 rejections, R4 breakouts, and S4 breakdowns.
### Input Settings
1. Calculation Engine:
* Camarilla Timeframe: Choose between Auto (Chart Adaptive), Daily, Weekly, or Monthly. The Auto setting assigns Daily to intraday charts (<= 15m), Weekly to intermediate timeframes (30m to 4h), and Monthly to daily/weekly charts.
* Display Mode: Active Period (Projected Lines & Zones), Historical Stepped Lines (Full History), or Both.
* Active Line Extension: Set how many bars forward the active levels project.
2. Levels Visibility:
* Independent visibility toggles for R5/S5, R4/S4, R3/S3, R2/S2, R1/S1, and the Central Pivot (P).
3. Shaded Zones:
* Toggles and custom color pickers for Range Zone (S3-R3), Buffer Zones (R3-R4 & S3-S4), Bull Breakout Zone (R4-R5), Bear Breakdown Zone (S4-S5), and the "NO-TRADE ZONE" text badge.
4. Signals & Alerts:
* Enable or disable visual markers for mean-reversion bounces and breakout momentum.
### Non-Repainting Guarantee
This indicator strictly accesses completed higher-timeframe bars using `request.security` with `lookahead = barmerge.lookahead_on` referencing closed bars `[1]`. Historical levels remain identical in real-time and after historical recalculation. No levels shift or repaint retroactively once the period opens.
Camarilla Pivot Points is an institutional-grade technical analysis indicator designed to project key intraday and swing support, resistance, and volatility expansion zones. Based on the mathematical framework introduced by Nick Stott in 1989, Camarilla pivots utilize the prior period's high, low, and close to establish statistically significant equilibrium and expansion thresholds.
Unlike traditional floor pivots, Camarilla levels place heavy emphasis on mean reversion within the central range while clearly distinguishing the boundary where explosive directional momentum begins.
This implementation features non-repainting higher timeframe data feeds, institutional zone shading, dedicated no-trade buffer zones, customizable display modes (projected active vs. full historical stepped lines), and optional real-time signal markers.
### Core Philosophy & Market Mechanics
Statistical market research demonstrates that asset prices spend approximately 75% to 80% of trading sessions consolidating within the central dealing range. Camarilla pivots capitalize on this structure by dividing the market into three distinct behavioral regimes:
1. Range Equilibrium (Mean Reversion Regime)
The space between Support 3 (S3) and Resistance 3 (R3) represents the core dealing range. When the market opens or trades within this band, institutional algorithms frequently fade extremes, targeting a return to the opposite level or the Central Pivot (P).
2. The Buffer Zone (No-Trade Regime)
The zones between R3 to R4 and S3 to S4 represent transitionary buffers. In these bands, mean reversion has failed to resolve immediately, but a structural breakout has not yet occurred. Trading within these zones exposes market participants to unfavorable risk-to-reward ratios and false breakouts (whipsaws). This indicator explicitly highlights these buffer areas as designated "No-Trade Zones."
3. Directional Momentum (Breakout Regime)
A sustained breach and candle close outside R4 (bullish) or S4 (bearish) signals institutional accumulation or distribution. Once price escapes the buffer zone, mean-reversion trading is invalidated, and directional trend-following rules take effect toward R5 and S5.
### Mathematical Framework
All calculations are derived from the prior completed higher timeframe bar (High, Low, Close) and the prevailing range (High - Low):
* Pivot Point (P) = (High + Low + Close) / 3
* R5 (Max Bullish Expansion / Target 2) = Close + Range * 1.1000
* R4 (Bullish Breakout Trigger) = Close + Range * 0.5500
* R3 (Primary Resistance / Mean Reversion) = Close + Range * 0.2750
* R2 (Intermediate Upper Buffer) = Close + Range * 0.1833
* R1 (Minor Upper Buffer) = Close + Range * 0.0916
* S1 (Minor Lower Buffer) = Close - Range * 0.0916
* S2 (Intermediate Lower Buffer) = Close - Range * 0.1833
* S3 (Primary Support / Mean Reversion) = Close - Range * 0.2750
* S4 (Bearish Breakdown Trigger) = Close - Range * 0.5500
* S5 (Max Bearish Expansion / Target 2) = Close - Range * 1.1000
### How to Trade with Camarilla Pivot Points
#### 1. Mean Reversion Setup (Inside-Out)
* Bias: Neutral to Range-Bound.
* Long Entry: Price dips to or sweeps S3, rejects lower prices, and closes back above S3.
* Short Entry: Price rallies to or tests R3, rejects higher prices, and closes back below R3.
* Take Profit: Central Pivot (P), opposite pivot boundary (S3 -> R3, or R3 -> S3).
* Stop Loss: Beyond the respective buffer zone (below S4 for longs, above R4 for shorts).
#### 2. The No-Trade Rule (Buffer Zones)
* Region: Between R3 and R4 (Upper Buffer) and between S3 and S4 (Lower Buffer).
* Rule: Avoid initiating new positions inside these bands. Wait for either a confirmed rejection back into the range (mean reversion) or a confirmed close beyond R4/S4 (trend breakout).
#### 3. Trend Breakout Setup (Expansion Runners)
* Bias: Strong Momentum / Trend-Following.
* Bullish Breakout: A candle closes cleanly above R4 with strong volume. Target: R5.
* Bearish Breakdown: A candle closes cleanly below S4 with strong volume. Target: S5.
* Stop Loss: Inside the buffer zone (below R3 for longs, above S3 for shorts).
### Visual & Structural Features
* Clean Active Projections: Extends clean, clutter-free horizontal lines into the future with dynamic price and level tags.
* Full Historical Stepped Lines: View unbroken multi-day or multi-week historical performance across the entire chart.
* Institutional Shaded Boxes:
- Range Equilibrium: Semi-transparent blue fill between S3 and R3.
- Buffer / No-Trade Zones: Caution amber fill between R3-R4 and S3-S4 with right-aligned badges.
- Bullish Expansion: Emerald green fill between R4 and R5.
- Bearish Expansion: Coral red fill between S4 and S5.
* Real-Time Signal Markers: Optional visual cues plotted on confirmed candle closes for S3 bounces, R3 rejections, R4 breakouts, and S4 breakdowns.
### Input Settings
1. Calculation Engine:
* Camarilla Timeframe: Choose between Auto (Chart Adaptive), Daily, Weekly, or Monthly. The Auto setting assigns Daily to intraday charts (<= 15m), Weekly to intermediate timeframes (30m to 4h), and Monthly to daily/weekly charts.
* Display Mode: Active Period (Projected Lines & Zones), Historical Stepped Lines (Full History), or Both.
* Active Line Extension: Set how many bars forward the active levels project.
2. Levels Visibility:
* Independent visibility toggles for R5/S5, R4/S4, R3/S3, R2/S2, R1/S1, and the Central Pivot (P).
3. Shaded Zones:
* Toggles and custom color pickers for Range Zone (S3-R3), Buffer Zones (R3-R4 & S3-S4), Bull Breakout Zone (R4-R5), Bear Breakdown Zone (S4-S5), and the "NO-TRADE ZONE" text badge.
4. Signals & Alerts:
* Enable or disable visual markers for mean-reversion bounces and breakout momentum.
### Non-Repainting Guarantee
This indicator strictly accesses completed higher-timeframe bars using `request.security` with `lookahead = barmerge.lookahead_on` referencing closed bars `[1]`. Historical levels remain identical in real-time and after historical recalculation. No levels shift or repaint retroactively once the period opens.
Note di rilascio
UPDATE SUMMARY--------------------------------------------------------------------------------
This major update introduces an advanced Dynamic ATR Stop Loss Engine, real-time
entry risk calculation badges, intelligent chart uncluttering triggers, and a
live on-chart ATR HUD.
Stop Loss placement has been completely re-architected to support both structure-
based traders and volatility-based quantitative traders.
WHAT'S NEW IN THIS VERSION
--------------------------------------------------------------------------------
1. ADVANCED DYNAMIC ATR STOP LOSS ENGINE
Traders can now calculate and project adaptive Stop Loss levels directly from
either Camarilla key levels or individual signal trigger candles.
New Stop Loss Anchor Modes:
• Signal Candle (Candle Height + ATR) [Recommended for Price Action]:
Measures the full candle range (High - Low) plus active ATR.
SL Distance = (High - Low) + (ATR * Multiplier).
Ensures your stop is always positioned safely beyond the entire trigger bar
with dynamic market volatility cushion added.
• Signal Candle (ATR + Buffer Points) [Recommended for Volatility Scalping]:
Pure volatility risk model anchored from the signal candle close.
SL Distance = (ATR * Multiplier) + Buffer Points.
Guarantees a reliable baseline stop without being skewed by outlier wicks.
• Camarilla Level (R3/S3 Static Line):
Projects horizontal dotted Stop Loss lines anchored directly behind key
Camarilla levels (e.g., R3 SL, S3 SL, R4 SL, S4 SL).
• Both (Level Line + Signal Candle Tags):
Simultaneously visualizes Camarilla level boundary stops and per-signal
candle execution tags.
2. SMART LEVEL VISITATION TRIGGERS (ZERO CHART CLUTTER)
To prevent unvisited levels from cluttering your screen during historical
review or live sessions, Level Stop Loss projection now supports 3 display triggers:
• When Level is Visited (Touch):
Stop Loss lines and labels only appear once price has actually touched or
tested that specific Camarilla level during the session.
• When Signal Fires:
SL lines and labels render only when an actionable Buy or Sell signal triggers.
• Always Show (Static Levels):
Projects SL boundary lines across the entire session from the open.
3. REAL-TIME RISK DISTANCE BADGES & FORWARD PROJECTION LINES
• Dotted forward projection lines extend for a user-defined duration (default: 10 bars)
from each signal candle, giving visual tracking of trade invalidation levels.
• Obsidian dark badge tags display the exact Stop Loss price and net point risk:
Example: "SL: 4173.5 (+5.0 pts)" or "SL: 4168.0 (-5.1 pts)".
4. TRADINGVIEW NATIVE ATR ENGINE
• Integrated native ATR calculation with customizable smoothing options:
RMA, SMA, EMA, and WMA.
• Fully customizable ATR Length, ATR Multiplier, and Buffer Points.
• Set Buffer Points to 0.0 to operate in pure ATR mode.
5. ON-CHART ATR STATUS BADGE (HUD)
• A sleek, compact on-chart table displaying:
Line 1: ATR Length, Smoothing method, and current point value.
Line 2: Active Buffer Points and combined Total SL distance.
• Configurable screen corner positioning (Top Right, Bottom Right, Top Left, Bottom Left).
SETTINGS CHEAT SHEET
--------------------------------------------------------------------------------
Group "06. Dynamic ATR Stop Loss Engine":
• Stop Loss Anchor Mode: Select between Candle Height + ATR, ATR + Buffer Points,
Camarilla Level, or Both.
• Apply SL To Levels: S3 & R3 Reversals, R4 & S4 Breakouts, or Both.
• Level SL Display Trigger: When Level is Visited, When Signal Fires, or Always Show.
• Buffer Points: Added fixed point cushion (e.g., 3.0 pts for Micro Gold MGC).
• Signal SL Line Length: Number of bars forward to draw the dotted invalidation line.
• Show On-Chart ATR Status Badge: Toggle the real-time HUD table.
RECOMMENDED WORKFLOW (FUTURES & GOLD / MGC / NQ)
--------------------------------------------------------------------------------
1. Set Stop Loss Anchor Mode to "Signal Candle (Candle Height + ATR)" for strict
invalidation behind reversal or breakout bars.
2. If trading during low-volatility Asian or pre-market sessions, switch to
"Signal Candle (ATR + Buffer Points)" with 3.0 buffer points to prevent stops
from compressing too tightly.
3. Keep Level SL Display Trigger on "When Level is Visited (Touch)" for the cleanest
chart presentation.
================================================================================
Note di rilascio
# Bug Fix• Fixed an issue where signals fired prematurely; Buy/Sell signals now trigger only after candle close.
Script open-source
Nello spirito di TradingView, l'autore di questo script lo ha reso open source, in modo che i trader possano esaminarne e verificarne la funzionalità. Complimenti all'autore! Sebbene sia possibile utilizzarlo gratuitamente, ricordiamo che la ripubblicazione del codice è soggetta al nostro Regolamento.

Declinazione di responsabilità
Le informazioni e le pubblicazioni non sono intese come, e non costituiscono, consulenza o raccomandazioni finanziarie, di investimento, di trading o di altro tipo fornite o approvate da TradingView. Per ulteriori informazioni, consultare i Termini di utilizzo.
Script open-source
Nello spirito di TradingView, l'autore di questo script lo ha reso open source, in modo che i trader possano esaminarne e verificarne la funzionalità. Complimenti all'autore! Sebbene sia possibile utilizzarlo gratuitamente, ricordiamo che la ripubblicazione del codice è soggetta al nostro Regolamento.
Declinazione di responsabilità
Le informazioni e le pubblicazioni non sono intese come, e non costituiscono, consulenza o raccomandazioni finanziarie, di investimento, di trading o di altro tipo fornite o approvate da TradingView. Per ulteriori informazioni, consultare i Termini di utilizzo.