Aggiornato
Pro Swing Analysis and Mitigation Zones
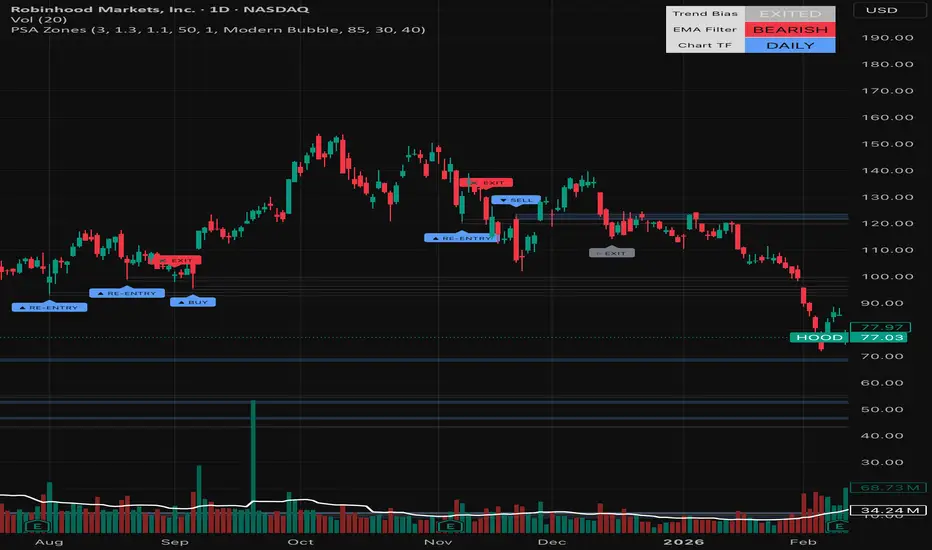
Pro Swing Analysis and Mitigation Zones
Introduction
The Pro Swing Analysis and Mitigation Zones is a technical analysis indicator designed to identify high-probability structural shifts and supply/demand levels. It is built for traders who focus on market structure and volume climaxes on higher timeframes such as Daily, Weekly, and Monthly charts.
Originality and Usefulness
This script is original in its approach to "Self-Mitigating Zones." While many indicators plot supply and demand zones, this script manages them dynamically using an internal array system. A zone is only kept on the chart as long as it remains "fresh"—as soon as price action closes through a zone (mitigating the structural level), the script automatically deletes it. This ensures the trader is always focused on active, unmitigated levels of interest.
Additionally, it features an automated Trendline Break logic. It constructs a dotted structural trendline based on the most recent two pivots of the same trend and monitors for price violations in real-time, providing early exit signals before a new structural high or low is even confirmed.
Underlying Logic
The indicator functions through three core layers of confirmation:
Fast Pivot Detection: It identifies local highs and lows confirmed by a 1-candle lookback for high responsiveness.
Volume Climax Confirmation: Every structural point is verified against a volume multiplier. A pivot is only considered a "Signal" if the volume on that bar significantly exceeds the recent average (10-period SMA).
Trend State Machine: The script tracks whether the market is currently in a Bullish or Bearish state to differentiate between new entries, re-entries, and structural exits.
Key Features
Multi-Timeframe Identity: Automatically applies colors based on the chart interval: Blue for Daily, Orange for Weekly, and Pink for Monthly.
Mitigation Zones: Supply and Demand zones that project into the future and self-delete upon price crossover.
Dynamic Dotted Trendlines: Automatically connects the last two structural points of the current trend to visualize momentum.
Bias Dashboard: A clean UI element in the corner of the chart summarizing the current trend bias and the number of active unmitigated zones.
How to Use
Entries: Look for the ENTER LONG/SHORT labels which appear on high-volume structural reversals.
Re-entries: Use the RE-ENTRY labels to scale into a trend during confirmed pullbacks.
Exits: Use the TL BREAK signal for early exits when price momentum fails, or wait for a full structural EXIT signal at a new opposing pivot.
Disclaimer
Trading involves a significant risk of loss. This indicator is for informational and educational purposes only and does not constitute financial advice. Past performance is not a guarantee of future results. Always use proper risk management and stop-loss orders.
Introduction
The Pro Swing Analysis and Mitigation Zones is a technical analysis indicator designed to identify high-probability structural shifts and supply/demand levels. It is built for traders who focus on market structure and volume climaxes on higher timeframes such as Daily, Weekly, and Monthly charts.
Originality and Usefulness
This script is original in its approach to "Self-Mitigating Zones." While many indicators plot supply and demand zones, this script manages them dynamically using an internal array system. A zone is only kept on the chart as long as it remains "fresh"—as soon as price action closes through a zone (mitigating the structural level), the script automatically deletes it. This ensures the trader is always focused on active, unmitigated levels of interest.
Additionally, it features an automated Trendline Break logic. It constructs a dotted structural trendline based on the most recent two pivots of the same trend and monitors for price violations in real-time, providing early exit signals before a new structural high or low is even confirmed.
Underlying Logic
The indicator functions through three core layers of confirmation:
Fast Pivot Detection: It identifies local highs and lows confirmed by a 1-candle lookback for high responsiveness.
Volume Climax Confirmation: Every structural point is verified against a volume multiplier. A pivot is only considered a "Signal" if the volume on that bar significantly exceeds the recent average (10-period SMA).
Trend State Machine: The script tracks whether the market is currently in a Bullish or Bearish state to differentiate between new entries, re-entries, and structural exits.
Key Features
Multi-Timeframe Identity: Automatically applies colors based on the chart interval: Blue for Daily, Orange for Weekly, and Pink for Monthly.
Mitigation Zones: Supply and Demand zones that project into the future and self-delete upon price crossover.
Dynamic Dotted Trendlines: Automatically connects the last two structural points of the current trend to visualize momentum.
Bias Dashboard: A clean UI element in the corner of the chart summarizing the current trend bias and the number of active unmitigated zones.
How to Use
Entries: Look for the ENTER LONG/SHORT labels which appear on high-volume structural reversals.
Re-entries: Use the RE-ENTRY labels to scale into a trend during confirmed pullbacks.
Exits: Use the TL BREAK signal for early exits when price momentum fails, or wait for a full structural EXIT signal at a new opposing pivot.
Disclaimer
Trading involves a significant risk of loss. This indicator is for informational and educational purposes only and does not constitute financial advice. Past performance is not a guarantee of future results. Always use proper risk management and stop-loss orders.
Note di rilascio
UPDATE: Pro Swing Analysis v2 — Trend Filtering & High-Accuracy LogicThis update introduces significant refinements to the core detection engine, focusing on reducing market noise and aligning signals with the dominant market trend.
What’s New in This Version?
1. Dual-Climax Confirmation (Signal Reduction)
To ensure that only the most significant structural turns are marked, we have introduced a Volatility Filter alongside the existing volume filter. A signal now requires a "Dual Climax":
Volume Climax: Trading activity must be at least 1.5x the recent average.
Volatility Climax: The candle's range (High-Low) must be at least 1.3x the recent average.
This prevents "weak" pivots from triggering signals during low-volatility consolidation.
2. Hidden EMA Trend Filter
We have added a customizable EMA Trend Filter (defaulting to the 200-period).
How it works: When enabled, the indicator will only show Long signals if the price is above the EMA and Short signals if the price is below the EMA.
Clean UI: The EMA line remains hidden to keep your chart uncluttered, but the logic is working in the background to ensure you are always trading in the direction of the primary trend.
3. Integrated High-Accuracy Alerts
You can now set dedicated alerts for Bullish and Bearish Reversals. These alerts only trigger when every single layer of confirmation aligns:
Confirmed structural pivot (4-bar lookback).
Volume Climax.
Volatility Climax.
EMA Trend Filter alignment.
Technical Deep Dive: The Logic
The indicator uses a "State Machine" to track the market's structural bias.
Detection: The script scans for local extrema using a 4-bar lookback.
Confirmation: Once a pivot is found, the script looks back at the "climax bar" to see if institutional volume and range expansion were present.
Filtering: The logic then cross-references the EMA Trend Filter to verify directional bias.
Execution: Only if all criteria are met does the script print a label and project a new Mitigation Zone.
How to Use the New Features:
Setting the Trend Filter: Go to the "Trend Filter" input group. You can adjust the length (e.g., 50 for mid-term, 200 for long-term) to suit your trading timeframe.
Configuring Alerts:
Open the Alerts dialogue.
Select the script as the condition.
Choose Bullish Reversal or Bearish Reversal.
Use "Once Per Bar Close" for maximum accuracy.
Reading the Dashboard: The dashboard now displays the active Trend Filter status and the number of unmitigated Supply/Demand zones currently remaining on the chart.
Disclaimer
Financial Risk Warning:
Technical analysis indicators are tools to assist in decision-making; they are not crystal balls. Trading involves a high risk of capital loss. The "high-accuracy" label refers to the strictness of the mathematical filters used in the code, not a guarantee of trade success.
Past performance is never a guarantee of future results. No indicator can predict the future with 100% certainty. Use this tool as part of a comprehensive trading plan that includes proper stop-losses and risk management.
Note di rilascio
UPDATE: Pro Swing Analysis v3 — Resilient Mitigation & Pro VisualsThis major update introduces "Resilient Mitigation Zones"—a high-end structural feature—alongside a complete visual overhaul for a professional trading interface.
New Core Feature: Resilient Mitigation (Ghost Zones)
The standout feature of this update is the introduction of Resilient Mitigation Zones. While most supply/demand indicators simply delete a zone once it is touched, this script uses a more advanced "Reclaim" logic:
Ghost Lines: When a structural level is broken, the zone transforms into a Ghost Line. This maintains the historical significance of the level on your chart without cluttering the view.
Reclaim Logic: If price action invalidates the breakout and closes back within the original structural range, the zone re-activates (resurrects) from its ghost state. This allows traders to identify "fakeouts" and institutional re-accumulation phases.
Customizable Brightness: Users can now control the visibility of these ghost levels through a dedicated "Ghost Line Brightness" setting.
Visual & Signal Overhaul
We have replaced standard labels with a professional Modern UI:
▲ BUY / ▼ SELL: High-accuracy entries confirmed by volume and volatility climaxes.
✖ EXIT: Early exit signals triggered by Trendline violations.
⚐ EXIT (Ghost Rejection): A new signal that triggers when price reaches an unmitigated Ghost Line and shows signs of rejection.
Visual Styles: Choose between "Modern Bubble" (solid tags) or "Floating Text" (minimalist symbols) in the settings.
Refined High-Accuracy Filtering
To ensure the highest quality signals, we have integrated a triple-filter system:
Structure: Confirmed pivots on Daily, Weekly, and Monthly timeframes.
Climax: Requires both a Volume Spike and a Volatility (Range) Spike.
Trend Filter: A customizable, hidden EMA filter ensures you are only taking Longs in an uptrend and Shorts in a downtrend.
How to Use
Monitor the Dashboard: Check the top-right corner to see your current MTF trend bias and how many active zones are currently unmitigated.
Trade the Reclaim: Pay close attention when a "Ghost Line" turns back into a solid "Active Zone"—this often signals a powerful move as the market reclaims a previous level of interest.
Configuring Exits: Use the Trendline Break (✖) and Ghost Rejection (⚐) signals for precision profit-taking.
Disclaimer
Financial Risk Warning:
Trading involves significant risk. This indicator is a technical analysis tool provided for educational purposes and does not constitute financial advice. The "High-Accuracy" nature of the signals refers to the strict mathematical criteria required for a signal to fire, and does not guarantee future profitability.
Past performance is not a guarantee of future results. Market conditions can change rapidly, and no algorithmic tool can account for all variables. Always use stop-losses and consult with a professional financial advisor before making investment decisions.

Declinazione di responsabilità
Le informazioni e le pubblicazioni non sono intese come, e non costituiscono, consulenza o raccomandazioni finanziarie, di investimento, di trading o di altro tipo fornite o approvate da TradingView. Per ulteriori informazioni, consultare i Termini di utilizzo.
Declinazione di responsabilità
Le informazioni e le pubblicazioni non sono intese come, e non costituiscono, consulenza o raccomandazioni finanziarie, di investimento, di trading o di altro tipo fornite o approvate da TradingView. Per ulteriori informazioni, consultare i Termini di utilizzo.