The Atlas: odds of a touch before the close
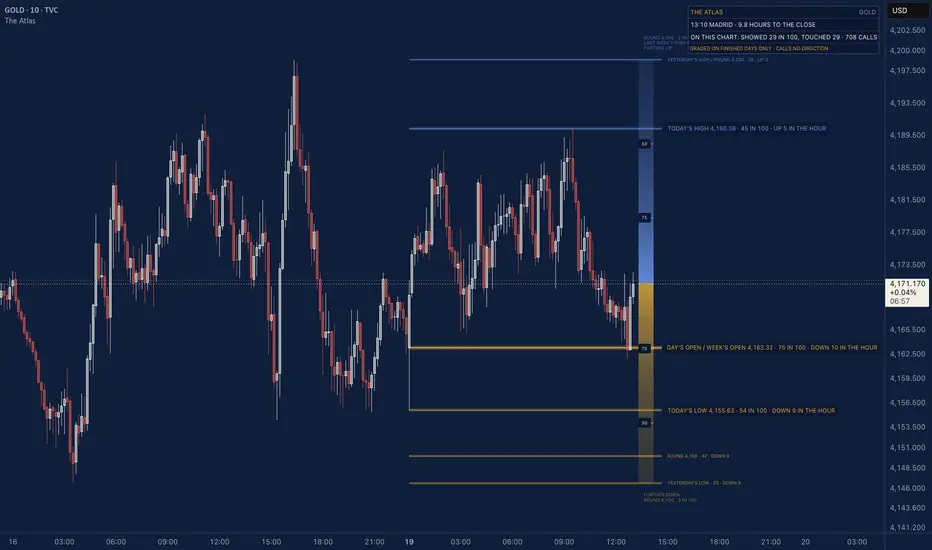
Which of today's levels can price still reach before the close, and at what odds? The Atlas draws today's levels and puts one figure on each: the odds of a touch before 17:00 New York, as graded on the chart you load it on.
WHAT IS NEW HERE
Level tools draw the lines, and probability tools print a model's odds and stop there. The Atlas starts from a random walk's odds, grades every one on your own chart, and shows each level's odds corrected by that record. On gold the walk alone says more than comes: when it said 50, 37 came. The figure on the chart is how often levels the walk rated alike were touched, from finished days only.
HOW THE ODDS ARE MADE
The start is a random walk, sized by yesterday's ATR and the hours left in the gold day: the same walk THE CLOCKFACE uses. The day's spread is taken as ATR divided by 1.596, the ratio of a random walk's average daily range to its spread, and shrinks with the square root of the hours left to 17:00 New York. The walk's odds of a touch before the close are 2 x (1 - Phi(d / s)), with d the distance from the last close to the level, s the spread for the hours left and Phi the standard normal distribution.
Then the chart grades it. The script stamps the walk's odds at 03:00, 10:00 and 14:00 New York on every level in force and grades each stamp at the day's close. From those graded calls it draws a curve: for each tenth of the walk's scale with 20 or more finished calls, what the walk said and how often the level was touched. The points are pooled so the curve never falls as the walk's figure rises, and read between by straight lines. Each level's figure is the walk's odds read off that curve. Only finished days build it, so today's figure never sees today. Until the curve has two points, a level shows the walk's own figure, marked (THE WALK).
At 14:00 New York on 7 October, gold at 4,109.89 with three hours left, the walk's figure and the figure shown: last week's low, 0.61 over the price, 98 and 98; yesterday's low, 5.86 under, 77 and 72; round 4,100, 9.89 under, 62 and 52; the week's open, 31.09 over, 12 and 8; round 4,150, 5 and 4; the day's open, under 1. By the close the first three had been reached and none of the others had.
On TVC:GOLD's 10 minute chart, 24 March to 7 October 2026, 137 whole days and 4,866 calls, the walk alone: said 5, 4 touched; said 30, 17; said 50, 37; said 70, 62; said 90, 87. Brier 0.110, against 0.190 for a flat guess at the overall rate. The figure the script shows, from 1 April, when the curve first had two points, to 7 October, 4,704 calls, each read only from the days before it: showed 4.3, touched 5.5; showed 28.1, touched 30.0; showed 49.8, touched 50.7; showed 70.1, touched 69.5; showed 90.5, touched 92.0. Brier 0.106 against the walk's 0.110 on the same calls. No test of either was written down before it ran, so the panel keeps scoring both on your chart.
WHAT IS DRAWN
Today's levels, each a line from the day's open to just past the last bar: last week's high and low, yesterday's high and low, today's high and low so far, the day's open, the week's open, and the round handles around the price, the two at or under it and the two over it, every 50 dollars by default. A level under the price is a floor, drawn in gold. A level over it is a ceiling, drawn in blue. Each glows by its odds: the likelier the touch, the brighter and thicker the line. The three levels next to the price carry their name, price and odds in words, and how those odds have moved over the last hour, for example TODAY'S HIGH 4,187.68 · 83 IN 100 · UP 2 IN THE HOUR. The other lines carry a small name, their odds and their change. Time running out pulls every level's odds down; price travelling toward a level pulls them up. Hover a label for the walk's own figure and the price and hours the change was measured from. Levels within a few dollars of each other, 0.03 of the day's ATR, share one line and one label, joined by a slash, as DAY'S OPEN / WEEK'S OPEN does on a Monday. Each keeps its own place in the ledger. A level gets its line once its odds reach 15 in 100. Up to three of the others on each side, the nearest, at 1 in 100 or more, are listed in small type with their price and odds, FURTHER UP above the ladder and FURTHER DOWN under it, so a level far from the price never squeezes the candles. As the price travels toward one, its odds rise and its line appears. A level price has already reached today keeps its line, dashed and dimmer, and its words say when it was first touched, for example YESTERDAY'S LOW 4,104.03 · TOUCHED 08:20 · 72 IN 100 AGAIN: the odds of a second touch before the close. Today's high, today's low and the day's open are touched by definition and never stamped. At 14:00 New York on 7 October all three lines on the chart had been touched earlier in the day: last week's low at 06:30, yesterday's low and round 4,100 at 08:20. THE LADDER: a strip beside the last bar, shaded at every price by its odds of a touch before the close, graded on this chart, gold under the price and blue over it, deeper where a touch is likelier. Rungs mark the prices where those odds are 75, 50 and 25 in 100. The level lines cross it, so each level sits on the ladder at its own odds. It runs out to the outer drawn line on each side, or to the 50 rung where that is further, so it stays within reach of the levels already drawn and leaves the candles their height. At 14:00 New York on 7 October, with three hours left, the rungs sat 4.98, 10.33 and 17.61 either side of the price. Last week's levels appear once the chart holds that whole week, and yesterday's once it holds that whole day. The chart's first day and first week may start part way, so they never count.
THE PANEL
Four lines by default. THE ATLAS and the symbol. The time in your clock and the hours left to the close. One line of proof, such as ON THIS CHART: SHOWED 29 IN 100, TOUCHED 29 · 708 CALLS, from whichever band between 20 and 80 holds the greater share of the graded calls. The footer. Levels table, when switched on: up to six levels in order of odds, the nearest first, under LEVEL, PRICE, ODDS and LAST HOUR, the odds cell shaded deeper as they rise. Full ledger, when switched on: every band of what the panel showed against what was touched, and the Brier, the average squared miss, against the walk's on the same calls. Lower is closer. Never reset.
SETTINGS
Clock (New York): New York, London or Madrid, for the time written in the panel. The gold day, the stamps and the close stay on New York's clock. Round handle step (50): the spacing of the round numbers. Levels labelled in full (3): how many levels, counted out from the price, carry their words. Lines from (15 in 100): the odds a level needs for its line; 0 draws every level. Change over (60 minutes): the span of each level's change, 10 to 240 minutes. Stamp levels touched today: on or off. Ladder: on or off, and its width in bars (5). Panel: on or off. Panel position: any corner. Levels table in the panel (off). Full ledger in the panel (off): every band of showed against touched, and the Brier.
LIMITS
Runs on intraday charts of 1 to 30 minutes that divide the half hour: 1, 5, 10, 15 or 30 minutes, for example. On any other chart the panel says so. The grading needs loaded history: the curve needs two tenths of the walk's scale with 20 finished calls each, about a week of stamps on gold, and fills out over the weeks after. Until then levels show the walk's figure, marked (THE WALK). A short history, such as a 1 minute chart's, gives a thinner curve. Built on gold's day, 18:00 to 17:00 New York; on another symbol the walk runs on that symbol's daily bars and the grading on that chart's own days. Stamps and grades are taken on closed bars; the live odds move with the price. It describes the day and calls no direction: the odds say how likely a touch is by the close, not which way price goes first. Our own maths and code, written from scratch. Free and open source. Past counts describe the past only.
WHAT IS NEW HERE
Level tools draw the lines, and probability tools print a model's odds and stop there. The Atlas starts from a random walk's odds, grades every one on your own chart, and shows each level's odds corrected by that record. On gold the walk alone says more than comes: when it said 50, 37 came. The figure on the chart is how often levels the walk rated alike were touched, from finished days only.
HOW THE ODDS ARE MADE
The start is a random walk, sized by yesterday's ATR and the hours left in the gold day: the same walk THE CLOCKFACE uses. The day's spread is taken as ATR divided by 1.596, the ratio of a random walk's average daily range to its spread, and shrinks with the square root of the hours left to 17:00 New York. The walk's odds of a touch before the close are 2 x (1 - Phi(d / s)), with d the distance from the last close to the level, s the spread for the hours left and Phi the standard normal distribution.
Then the chart grades it. The script stamps the walk's odds at 03:00, 10:00 and 14:00 New York on every level in force and grades each stamp at the day's close. From those graded calls it draws a curve: for each tenth of the walk's scale with 20 or more finished calls, what the walk said and how often the level was touched. The points are pooled so the curve never falls as the walk's figure rises, and read between by straight lines. Each level's figure is the walk's odds read off that curve. Only finished days build it, so today's figure never sees today. Until the curve has two points, a level shows the walk's own figure, marked (THE WALK).
At 14:00 New York on 7 October, gold at 4,109.89 with three hours left, the walk's figure and the figure shown: last week's low, 0.61 over the price, 98 and 98; yesterday's low, 5.86 under, 77 and 72; round 4,100, 9.89 under, 62 and 52; the week's open, 31.09 over, 12 and 8; round 4,150, 5 and 4; the day's open, under 1. By the close the first three had been reached and none of the others had.
On TVC:GOLD's 10 minute chart, 24 March to 7 October 2026, 137 whole days and 4,866 calls, the walk alone: said 5, 4 touched; said 30, 17; said 50, 37; said 70, 62; said 90, 87. Brier 0.110, against 0.190 for a flat guess at the overall rate. The figure the script shows, from 1 April, when the curve first had two points, to 7 October, 4,704 calls, each read only from the days before it: showed 4.3, touched 5.5; showed 28.1, touched 30.0; showed 49.8, touched 50.7; showed 70.1, touched 69.5; showed 90.5, touched 92.0. Brier 0.106 against the walk's 0.110 on the same calls. No test of either was written down before it ran, so the panel keeps scoring both on your chart.
WHAT IS DRAWN
Today's levels, each a line from the day's open to just past the last bar: last week's high and low, yesterday's high and low, today's high and low so far, the day's open, the week's open, and the round handles around the price, the two at or under it and the two over it, every 50 dollars by default. A level under the price is a floor, drawn in gold. A level over it is a ceiling, drawn in blue. Each glows by its odds: the likelier the touch, the brighter and thicker the line. The three levels next to the price carry their name, price and odds in words, and how those odds have moved over the last hour, for example TODAY'S HIGH 4,187.68 · 83 IN 100 · UP 2 IN THE HOUR. The other lines carry a small name, their odds and their change. Time running out pulls every level's odds down; price travelling toward a level pulls them up. Hover a label for the walk's own figure and the price and hours the change was measured from. Levels within a few dollars of each other, 0.03 of the day's ATR, share one line and one label, joined by a slash, as DAY'S OPEN / WEEK'S OPEN does on a Monday. Each keeps its own place in the ledger. A level gets its line once its odds reach 15 in 100. Up to three of the others on each side, the nearest, at 1 in 100 or more, are listed in small type with their price and odds, FURTHER UP above the ladder and FURTHER DOWN under it, so a level far from the price never squeezes the candles. As the price travels toward one, its odds rise and its line appears. A level price has already reached today keeps its line, dashed and dimmer, and its words say when it was first touched, for example YESTERDAY'S LOW 4,104.03 · TOUCHED 08:20 · 72 IN 100 AGAIN: the odds of a second touch before the close. Today's high, today's low and the day's open are touched by definition and never stamped. At 14:00 New York on 7 October all three lines on the chart had been touched earlier in the day: last week's low at 06:30, yesterday's low and round 4,100 at 08:20. THE LADDER: a strip beside the last bar, shaded at every price by its odds of a touch before the close, graded on this chart, gold under the price and blue over it, deeper where a touch is likelier. Rungs mark the prices where those odds are 75, 50 and 25 in 100. The level lines cross it, so each level sits on the ladder at its own odds. It runs out to the outer drawn line on each side, or to the 50 rung where that is further, so it stays within reach of the levels already drawn and leaves the candles their height. At 14:00 New York on 7 October, with three hours left, the rungs sat 4.98, 10.33 and 17.61 either side of the price. Last week's levels appear once the chart holds that whole week, and yesterday's once it holds that whole day. The chart's first day and first week may start part way, so they never count.
THE PANEL
Four lines by default. THE ATLAS and the symbol. The time in your clock and the hours left to the close. One line of proof, such as ON THIS CHART: SHOWED 29 IN 100, TOUCHED 29 · 708 CALLS, from whichever band between 20 and 80 holds the greater share of the graded calls. The footer. Levels table, when switched on: up to six levels in order of odds, the nearest first, under LEVEL, PRICE, ODDS and LAST HOUR, the odds cell shaded deeper as they rise. Full ledger, when switched on: every band of what the panel showed against what was touched, and the Brier, the average squared miss, against the walk's on the same calls. Lower is closer. Never reset.
SETTINGS
Clock (New York): New York, London or Madrid, for the time written in the panel. The gold day, the stamps and the close stay on New York's clock. Round handle step (50): the spacing of the round numbers. Levels labelled in full (3): how many levels, counted out from the price, carry their words. Lines from (15 in 100): the odds a level needs for its line; 0 draws every level. Change over (60 minutes): the span of each level's change, 10 to 240 minutes. Stamp levels touched today: on or off. Ladder: on or off, and its width in bars (5). Panel: on or off. Panel position: any corner. Levels table in the panel (off). Full ledger in the panel (off): every band of showed against touched, and the Brier.
LIMITS
Runs on intraday charts of 1 to 30 minutes that divide the half hour: 1, 5, 10, 15 or 30 minutes, for example. On any other chart the panel says so. The grading needs loaded history: the curve needs two tenths of the walk's scale with 20 finished calls each, about a week of stamps on gold, and fills out over the weeks after. Until then levels show the walk's figure, marked (THE WALK). A short history, such as a 1 minute chart's, gives a thinner curve. Built on gold's day, 18:00 to 17:00 New York; on another symbol the walk runs on that symbol's daily bars and the grading on that chart's own days. Stamps and grades are taken on closed bars; the live odds move with the price. It describes the day and calls no direction: the odds say how likely a touch is by the close, not which way price goes first. Our own maths and code, written from scratch. Free and open source. Past counts describe the past only.

The Fan: 7 days free, then €149.99/month. Cancel before day 7 and pay nothing.
Start the trial: thesimplifier7.com/method.html
The record, every miss kept: thesimplifier7.com
Questions: DM @TheSimplifier7 on X
Start the trial: thesimplifier7.com/method.html
The record, every miss kept: thesimplifier7.com
Questions: DM @TheSimplifier7 on X
Declinazione di responsabilità
Le informazioni e le pubblicazioni non sono intese come, e non costituiscono, consulenza o raccomandazioni finanziarie, di investimento, di trading o di altro tipo fornite o approvate da TradingView. Per ulteriori informazioni, consultare i Termini di utilizzo.
The Fan: 7 days free, then €149.99/month. Cancel before day 7 and pay nothing.
Start the trial: thesimplifier7.com/method.html
The record, every miss kept: thesimplifier7.com
Questions: DM @TheSimplifier7 on X
Start the trial: thesimplifier7.com/method.html
The record, every miss kept: thesimplifier7.com
Questions: DM @TheSimplifier7 on X
Declinazione di responsabilità
Le informazioni e le pubblicazioni non sono intese come, e non costituiscono, consulenza o raccomandazioni finanziarie, di investimento, di trading o di altro tipo fornite o approvate da TradingView. Per ulteriori informazioni, consultare i Termini di utilizzo.