OPEN-SOURCE SCRIPT
Swing Data Pro - Intraday Trend and Relative Strength Dashboard
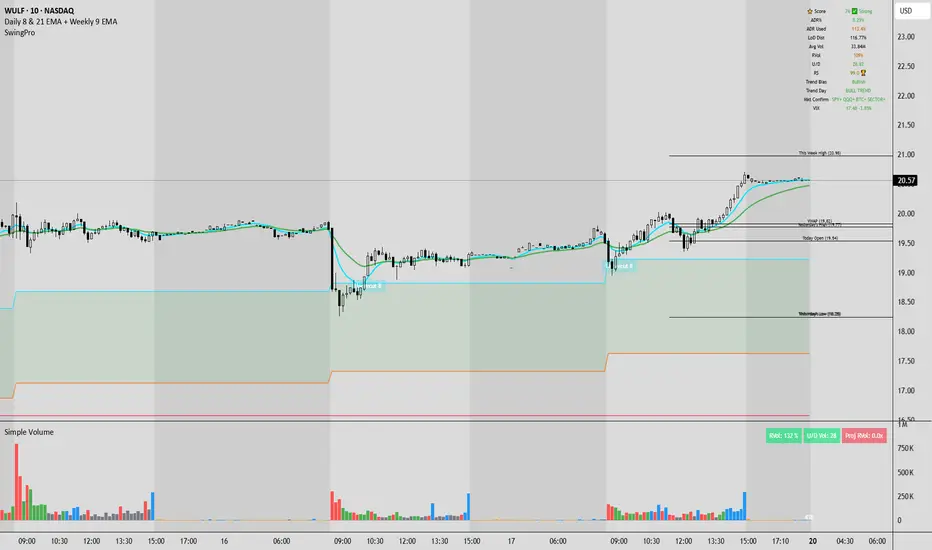
Swing Data Pro is a clean decision-support dashboard built for traders who want to combine intraday structure with higher-quality context before entering a trade.
This script is designed to help you quickly answer the most important questions:
- Is the stock acting bullish, bearish, or mixed right now?
- Is the move confirmed by volume and participation?
- Is the broader market helping or fighting the trade?
- Has the stock already used too much of its normal daily range?
- Is this ticker showing real relative strength, or is it just moving with noise?
Instead of relying on one signal, this tool organizes multiple layers of information into one compact panel so you can make faster and more structured decisions.
MAIN FEATURES
1) Setup Score
A quick snapshot score built from key quality inputs such as relative strength, volume, and range behavior.
This helps rank the overall quality of the setup at a glance.
2) ADR%, Day Range %, and ADR Used %
ADR% shows the stock’s average daily range.
Day Range % shows how much the stock has ranged today.
ADR Used % shows how much of the stock’s normal daily range has already been used.
Why this matters:
If a stock already used most of its typical daily range, the move may be getting extended and harder to chase.
3) ATR%, Day Move %, ATR Used %, and ATR ($)
ATR% helps compare daily movement across stocks with different prices.
Day Move % shows the move from today’s open to the current price.
ATR Used % helps show how much of the stock’s typical move has already been consumed.
ATR ($) helps estimate normal dollar movement for stops and targets.
4) Relative Volume (RVol)
This script uses intraday relative volume logic so participation is more relevant for active trading.
That makes RVol more useful for intraday entries instead of only relying on broad daily comparisons.
5) U/D Volume Ratio
The U/D reading is used as a pressure gauge to see whether buying or selling volume is more dominant.
This helps separate real trend participation from weak or unstable movement.
6) Relative Strength (RS)
The RS reading is designed to show whether the stock is outperforming the broader market.
In general, stronger RS names are often better candidates for long setups, while weak RS names are often lower quality for longs.
7) Trend Bias
Trend Bias simplifies price structure into:
- Bullish
- Bearish
- Mixed
This is based on how price is behaving relative to important structure such as today’s open and VWAP.
It is meant to answer one simple question:
“What is price doing right now?”
8) Trend Day
Trend Day is the confirmation layer.
This helps determine whether the current directional bias is being supported by participation conditions such as volume and U/D.
Possible outputs include:
- BULL TREND
- BEAR TREND
- BALANCED
This is useful because a stock can look bullish on price structure alone, but still not have enough participation to qualify as a stronger trend day.
9) Market Confirm
The Market Confirm row checks broader alignment using:
- SPY
- QQQ
- BTC
- Sector ETF
This helps you quickly judge whether the wider environment is supportive or conflicting.
A bullish individual stock setup is generally stronger when the broader market and sector are aligned.
10) VIX Label
The VIX row shows the actual VIX price and daily direction.
If VIX is rising, that often signals increasing market stress.
If VIX is falling, that often supports better risk appetite.
The row is color-coded for easier reading.
11) Key Levels
The script can display key reference levels such as:
- Today’s Open
- Yesterday’s High / Low
- Pre-Market High / Low
- VWAP
- This Week High / Low
- Last Week High / Low
These levels are useful for planning entries, exits, breakdowns, reclaims, and rejection areas.
12) Moving Averages
Optional EMA and SMA overlays are included for traders who want moving-average structure directly on the chart.
13) Candle Pattern Detection
The script includes optional bullish candle pattern highlights to help identify useful reversal or continuation candles.
HOW TO USE IT
A simple workflow:
Step 1:
Check Trend Bias.
This gives you the immediate structural read:
Bullish, Bearish, or Mixed.
Step 2:
Check Trend Day.
This tells you whether participation confirms the move or whether the stock is still more balanced.
Step 3:
Check Market Confirm.
Look at SPY, QQQ, BTC, and the sector ETF.
The best trades often happen when the stock and broader market are aligned.
Step 4:
Check RVol and U/D.
Strong trends usually look better when both participation and pressure support the move.
Step 5:
Check ADR Used % and ATR Used %.
These help you avoid chasing moves that may already be too extended.
Step 6:
Use the key levels.
Look for reclaims, breakouts, pullbacks, holds, or failures around important reference levels.
PRACTICAL INTERPRETATION
For long ideas:
- Trend Bias should preferably be Bullish
- Trend Day should ideally improve toward BULL TREND
- Market Confirm should lean positive
- RVol and U/D should support the move
- ADR Used % should not be overly stretched if you are entering late
For short ideas:
- Trend Bias should preferably be Bearish
- Trend Day should ideally improve toward BEAR TREND
- Market Confirm should lean negative
- Participation should support downside pressure
- Avoid forcing shorts if the broader market is strongly risk-on
WHO THIS IS FOR
This script is best suited for:
- Intraday traders
- Momentum traders
- Breakout traders
- Pullback traders
- Swing traders who want a stronger intraday timing panel
It is not meant to be a fully automated buy/sell system.
It is a structured decision-support tool designed to improve context, timing, and trade filtering.
NOTES
- No indicator should be used alone.
- Always combine signal quality with price action, levels, risk management, and your own trading plan.
- This script is for educational and decision-support purposes only and is not financial advice.
This script is designed to help you quickly answer the most important questions:
- Is the stock acting bullish, bearish, or mixed right now?
- Is the move confirmed by volume and participation?
- Is the broader market helping or fighting the trade?
- Has the stock already used too much of its normal daily range?
- Is this ticker showing real relative strength, or is it just moving with noise?
Instead of relying on one signal, this tool organizes multiple layers of information into one compact panel so you can make faster and more structured decisions.
MAIN FEATURES
1) Setup Score
A quick snapshot score built from key quality inputs such as relative strength, volume, and range behavior.
This helps rank the overall quality of the setup at a glance.
2) ADR%, Day Range %, and ADR Used %
ADR% shows the stock’s average daily range.
Day Range % shows how much the stock has ranged today.
ADR Used % shows how much of the stock’s normal daily range has already been used.
Why this matters:
If a stock already used most of its typical daily range, the move may be getting extended and harder to chase.
3) ATR%, Day Move %, ATR Used %, and ATR ($)
ATR% helps compare daily movement across stocks with different prices.
Day Move % shows the move from today’s open to the current price.
ATR Used % helps show how much of the stock’s typical move has already been consumed.
ATR ($) helps estimate normal dollar movement for stops and targets.
4) Relative Volume (RVol)
This script uses intraday relative volume logic so participation is more relevant for active trading.
That makes RVol more useful for intraday entries instead of only relying on broad daily comparisons.
5) U/D Volume Ratio
The U/D reading is used as a pressure gauge to see whether buying or selling volume is more dominant.
This helps separate real trend participation from weak or unstable movement.
6) Relative Strength (RS)
The RS reading is designed to show whether the stock is outperforming the broader market.
In general, stronger RS names are often better candidates for long setups, while weak RS names are often lower quality for longs.
7) Trend Bias
Trend Bias simplifies price structure into:
- Bullish
- Bearish
- Mixed
This is based on how price is behaving relative to important structure such as today’s open and VWAP.
It is meant to answer one simple question:
“What is price doing right now?”
8) Trend Day
Trend Day is the confirmation layer.
This helps determine whether the current directional bias is being supported by participation conditions such as volume and U/D.
Possible outputs include:
- BULL TREND
- BEAR TREND
- BALANCED
This is useful because a stock can look bullish on price structure alone, but still not have enough participation to qualify as a stronger trend day.
9) Market Confirm
The Market Confirm row checks broader alignment using:
- SPY
- QQQ
- BTC
- Sector ETF
This helps you quickly judge whether the wider environment is supportive or conflicting.
A bullish individual stock setup is generally stronger when the broader market and sector are aligned.
10) VIX Label
The VIX row shows the actual VIX price and daily direction.
If VIX is rising, that often signals increasing market stress.
If VIX is falling, that often supports better risk appetite.
The row is color-coded for easier reading.
11) Key Levels
The script can display key reference levels such as:
- Today’s Open
- Yesterday’s High / Low
- Pre-Market High / Low
- VWAP
- This Week High / Low
- Last Week High / Low
These levels are useful for planning entries, exits, breakdowns, reclaims, and rejection areas.
12) Moving Averages
Optional EMA and SMA overlays are included for traders who want moving-average structure directly on the chart.
13) Candle Pattern Detection
The script includes optional bullish candle pattern highlights to help identify useful reversal or continuation candles.
HOW TO USE IT
A simple workflow:
Step 1:
Check Trend Bias.
This gives you the immediate structural read:
Bullish, Bearish, or Mixed.
Step 2:
Check Trend Day.
This tells you whether participation confirms the move or whether the stock is still more balanced.
Step 3:
Check Market Confirm.
Look at SPY, QQQ, BTC, and the sector ETF.
The best trades often happen when the stock and broader market are aligned.
Step 4:
Check RVol and U/D.
Strong trends usually look better when both participation and pressure support the move.
Step 5:
Check ADR Used % and ATR Used %.
These help you avoid chasing moves that may already be too extended.
Step 6:
Use the key levels.
Look for reclaims, breakouts, pullbacks, holds, or failures around important reference levels.
PRACTICAL INTERPRETATION
For long ideas:
- Trend Bias should preferably be Bullish
- Trend Day should ideally improve toward BULL TREND
- Market Confirm should lean positive
- RVol and U/D should support the move
- ADR Used % should not be overly stretched if you are entering late
For short ideas:
- Trend Bias should preferably be Bearish
- Trend Day should ideally improve toward BEAR TREND
- Market Confirm should lean negative
- Participation should support downside pressure
- Avoid forcing shorts if the broader market is strongly risk-on
WHO THIS IS FOR
This script is best suited for:
- Intraday traders
- Momentum traders
- Breakout traders
- Pullback traders
- Swing traders who want a stronger intraday timing panel
It is not meant to be a fully automated buy/sell system.
It is a structured decision-support tool designed to improve context, timing, and trade filtering.
NOTES
- No indicator should be used alone.
- Always combine signal quality with price action, levels, risk management, and your own trading plan.
- This script is for educational and decision-support purposes only and is not financial advice.
Script open-source
Nello spirito di TradingView, l'autore di questo script lo ha reso open source, in modo che i trader possano esaminarne e verificarne la funzionalità. Complimenti all'autore! Sebbene sia possibile utilizzarlo gratuitamente, ricordiamo che la ripubblicazione del codice è soggetta al nostro Regolamento.

Declinazione di responsabilità
Le informazioni e le pubblicazioni non sono intese come, e non costituiscono, consulenza o raccomandazioni finanziarie, di investimento, di trading o di altro tipo fornite o approvate da TradingView. Per ulteriori informazioni, consultare i Termini di utilizzo.
Script open-source
Nello spirito di TradingView, l'autore di questo script lo ha reso open source, in modo che i trader possano esaminarne e verificarne la funzionalità. Complimenti all'autore! Sebbene sia possibile utilizzarlo gratuitamente, ricordiamo che la ripubblicazione del codice è soggetta al nostro Regolamento.
Declinazione di responsabilità
Le informazioni e le pubblicazioni non sono intese come, e non costituiscono, consulenza o raccomandazioni finanziarie, di investimento, di trading o di altro tipo fornite o approvate da TradingView. Per ulteriori informazioni, consultare i Termini di utilizzo.