OPEN-SOURCE SCRIPT
Aggiornato 4C Options Expected Move (Weekly + 0DTE)
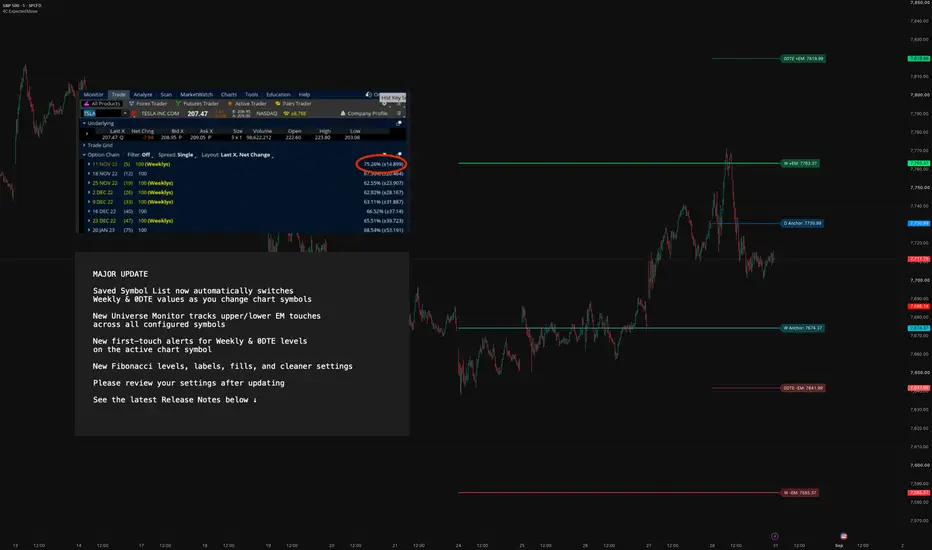
This indicator plots the calculated Expected Move for BOTH Weekly and Zero Dated Expiration (0DTE) Daily options, for a quick visual reference.
Please Note: This indicator is different from our original "4C Expected Move (Weekly Options)" indicator, as it now packages the ability to ALSO plot 0DTE options expected moves along with Weekly expected moves. Many other newer features have also been implemented.
Background Information
The Expected Move (EM) is the amount that a stock is predicted to increase or decrease from its current price, based on the current level of options pricing and implied volatility.
This range can be viewed as possible support and resistance, or, once price gets outside of the range, institutional hedging actions can accelerate the move in that direction.
It can be useful to know what the weekly EM range is for a stock to understand the probabilities of the overall distance, direction and volatility for the week.
About the Indicator
This indicator plots the calculated Expected Move for BOTH Weekly and Zero Dated Expiration (0DTE) options, for a quick visual reference.
For the weekly EM, the range is based on the Weekly close of the prior week.
For the Daily EM based on 0DTE options, the range is based on the Daily close of the prior day.
The indicator will automatically start a new weekly EM plot at the beginning of the week, and a new daily EM at the beginning of each day.
The EM values must be updated weekly and/or daily.
Features
Settings
How To Set Up The Indicator
To use this indicator you must have access to a broker with options data (not available on Tradingview).
Usually, you can look at the stock's option chain to find the weekly expected move.
You will have to do your own research to find where this information is displayed depending on your broker. You may also need to find the information elsewhere if your broker does not have this information.
You can also do your calculation of the EM using the following formula (please do your own research):
Expected Move = Option Price x Implied Volatility x Square Root of Time
See screenshot example below
This is the Thinkorswim platform's option chain, and the Implied Volatility % and the calculated EM are on the right side of the option chain.
The Expected Move is circled in blue. Use the +- number in parentheses, NOT the % value.
For the weekly EM, input the number that corresponds to the weekly option into the indicator. This must be done on a weekly basis, and It is typically best to use the EM for the next week expiration that is generated AFTER the Friday close and/or before the Monday open of the upcoming week.
For the daily EM, input the number that corresponds to the daily 0DTE option into the indicator. This must be done on a daily basis, and it is typically best to use the EM value for the 0DTE option that is generated the night before (after market close), or before the market opens for that 0DTE. .

Please Note: This indicator is different from our original "4C Expected Move (Weekly Options)" indicator, as it now packages the ability to ALSO plot 0DTE options expected moves along with Weekly expected moves. Many other newer features have also been implemented.
Background Information
The Expected Move (EM) is the amount that a stock is predicted to increase or decrease from its current price, based on the current level of options pricing and implied volatility.
This range can be viewed as possible support and resistance, or, once price gets outside of the range, institutional hedging actions can accelerate the move in that direction.
It can be useful to know what the weekly EM range is for a stock to understand the probabilities of the overall distance, direction and volatility for the week.
About the Indicator
This indicator plots the calculated Expected Move for BOTH Weekly and Zero Dated Expiration (0DTE) options, for a quick visual reference.
For the weekly EM, the range is based on the Weekly close of the prior week.
For the Daily EM based on 0DTE options, the range is based on the Daily close of the prior day.
The indicator will automatically start a new weekly EM plot at the beginning of the week, and a new daily EM at the beginning of each day.
The EM values must be updated weekly and/or daily.
Features
- Plots the EM for the week
- Plots the EM for the day, for symbols that offer daily expiration options
- Plots the 2 Standard Deviation EM for both the weekly and daily EM
- Labels with calculated values are plotted near the levels for quick visual aid
Settings
- Can toggle weekly EM on/off
- Can toggle Daily EM on/off
- Can toggle 2 Standard Deviation lines on/off
- Can toggle labels for all EM on/off
- Robust line settings
- Can adjust label location left/right based on personal preference
- Can enter symbol into settings as a reference
- Handy instructions in the settings
How To Set Up The Indicator
To use this indicator you must have access to a broker with options data (not available on Tradingview).
Usually, you can look at the stock's option chain to find the weekly expected move.
You will have to do your own research to find where this information is displayed depending on your broker. You may also need to find the information elsewhere if your broker does not have this information.
You can also do your calculation of the EM using the following formula (please do your own research):
Expected Move = Option Price x Implied Volatility x Square Root of Time
See screenshot example below
This is the Thinkorswim platform's option chain, and the Implied Volatility % and the calculated EM are on the right side of the option chain.
The Expected Move is circled in blue. Use the +- number in parentheses, NOT the % value.
For the weekly EM, input the number that corresponds to the weekly option into the indicator. This must be done on a weekly basis, and It is typically best to use the EM for the next week expiration that is generated AFTER the Friday close and/or before the Monday open of the upcoming week.
For the daily EM, input the number that corresponds to the daily 0DTE option into the indicator. This must be done on a daily basis, and it is typically best to use the EM value for the 0DTE option that is generated the night before (after market close), or before the market opens for that 0DTE. .
Note di rilascio
4/18/23 Added ability to change the Expected Move Label Color.Note di rilascio
Small change to hide the indicator on Daily timeframes and above.Note di rilascio
Update Description:Issue Fixed: Vertical Lines on the First Opening Bar
In the previous version of this indicator, a bug caused the expected move lines to plot vertically on the first bar of the trading day. This issue occurred because the lines were initialized with both start (x1) and end (x2) coordinates set to the same bar_index at the market open. As a result, the lines appeared vertical for the duration of the first bar.
How the Update Fixes the Issue:
Delayed Line Creation: The updated code ensures that the lines are only created after the first bar of the day has fully formed. By checking if bar_index > 1 before initializing the lines, we ensure that the lines extend horizontally from the start.
Conditional Initialization: The lines are now conditionally initialized only when a new day begins (isNewDay). This prevents the premature creation of lines at the market open and ensures they are plotted correctly as horizontal lines.
Proper Line Extension: After the lines are created, the code sets the x2 coordinate to bar_index + 1, ensuring that the lines extend to the right immediately after creation, preventing any vertical lines from appearing.
Result: This update resolves the issue, ensuring that all expected move lines (including 0DTE and 2-sigma lines) are plotted as horizontal lines from the first completed bar of the day, eliminating any vertical line artifacts at the market open.
Note di rilascio
Fixed bug where the Prior Day Close was plotting the "D" close[2] when the Extended Hours Chart was turned on, instead of "D" close[1]Note di rilascio
Fixed bug where trying to customize the Prior Daily Close color did not work.Note di rilascio
Fixed bug where trying to customize the 0DTE expected move Colors did not work.Note di rilascio
Fixed bug where weekly EM levels were being plotted vertically during the fist bar of the week (on any timeframe).e.g. If the chart timeframe was the 60 minute chart, and less than 60 mins had elapsed at the beginning of the week, then the lines would be vertical. after the 1st 60minute bar had closed, the lines would go back to normal and horizontal.
Note di rilascio
Small label fixNote di rilascio
MAJOR UPDATE - SAVED SYMBOLS, 0DTE, AND UNIVERSE MONITORThis release is a substantial rebuild of 4C Options Expected Move. The input workflow, multi-symbol support, chart drawings, labels, visual monitoring, customization, and alerts have all been expanded.
Existing users should review their indicator settings after updating because several inputs, defaults, and settings sections have changed.
EXPECTED MOVE VALUES
This indicator does not calculate expected moves automatically. Enter the expected-move values supplied by your broker or another options-analysis resource. All expected moves are entered as raw price points.
When collecting values from a broker, it is generally best to record them within the first hour after market close and before the next open.
For Weekly, collect the value between Friday's close and Monday's open.
For 0DTE, collect the value after the prior close and before that trading session opens.
NEW EXPECTED MOVE INPUT WORKFLOW
Current chart mode applies one Weekly value and one 0DTE value directly to the active chart.
Saved symbol list mode provides 14 editable symbol rows. Enter W for Weekly and D for 0DTE.
When you change the chart symbol, the indicator finds the first exact saved-symbol match and automatically loads that row's W and D values. No additional editing is required while switching between configured symbols.
A value of 0 disables only that timeframe. If no saved symbol matches the chart, neither range is drawn and a warning appears. If duplicate symbols are entered, the first matching row is used.
All saved values default to 0.
The included editable symbol list contains SPX, SPY, QQQ, IWM, AAPL, AMD, AMZN, GOOGL, META, MSFT, NVDA, PLTR, SPCX, and TSLA.
NEW UNIVERSE MONITOR
The Universe Monitor appears automatically when Saved symbol list mode is selected. It can also be enabled separately while using Current chart mode.
The monitor includes every configured saved symbol and displays the current Weekly and 0DTE 1x status.
Inside means neither boundary has been touched.
Upper means the upper boundary has been touched.
Lower means the lower boundary has been touched.
Both means both boundaries have been touched.
Weekly touches remain displayed until the next weekly reset. 0DTE touches remain displayed until the next daily reset. A missing Weekly or 0DTE value displays a dash.
The table position and size can be changed in Settings. The default table size is Normal.
The Universe Monitor is visual only. It does not create alerts for every saved symbol. Market-data permissions and feed delays may also affect monitored symbols.
WEEKLY AND 0DTE IMPROVEMENTS
Weekly and 0DTE expected-move ranges can now be enabled independently.
Automatic anchors use the confirmed prior weekly and daily closes.
Manual weekly and 0DTE anchor overrides remain available in Current chart mode for users who need to match a broker settlement or another reference price.
Optional 2x expected-move boundaries are available separately for Weekly and 0DTE.
Weekly and 0DTE labels can be shown or hidden independently. Label size, offset, text color, and background transparency are adjustable.
Main expected-move levels can also be displayed on the price axis.
Lines no longer extend right by default. When chart labels are enabled, each line ends at its label.
NEW LINE CUSTOMIZATION
Every Upper 1x, Anchor, Lower 1x, Upper 2x, and Lower 2x line has its own color, line style, and width control.
Weekly lines default to width 2.
0DTE lines default to width 1 so daily levels remain visually lighter than weekly levels.
The 0DTE levels use a related emerald, blue, and coral palette so they remain familiar while being distinguishable from Weekly levels.
NEW RANGE SHADING
Weekly and 0DTE 1x ranges can be shaded independently.
The upper and lower halves use separate colors and are divided at the anchor.
The default fills use 3 percent visible opacity so they remain subtle behind price candles.
NEW FIBONACCI LEVELS
Optional Fibonacci subdivisions can now be drawn between the anchor and both sides of the expected-move range.
Available levels are 23.6, 38.2, 50, 61.8, and 78.6 percent.
Weekly and 0DTE Fibonacci levels can be enabled independently.
Fibonacci line style, width, colors, label size, chart labels, and price-axis values are adjustable.
ALERTS
The indicator includes first-touch alerts for enabled Weekly and 0DTE 1x and 2x boundaries.
For detailed boundary messages, create a TradingView alert using the Any alert() function call condition.
Alert messages identify the active chart symbol, the boundary that was touched, and the current level price.
Alerts evaluate only the active chart symbol. The Universe Monitor does not generate cross-symbol alerts.
NEW DEFAULTS
Expected move source defaults to Current chart.
Weekly is enabled by default.
0DTE is disabled by default.
Weekly and 0DTE labels default to enabled. The 0DTE labels appear automatically when 0DTE is turned on.
Saved-symbol values default to 0.
Lines do not extend right by default.
Weekly lines default to width 2.
0DTE lines default to width 1.
Fibonacci levels, 2x levels, and range fills remain optional.
Script open-source
Nello spirito di TradingView, l'autore di questo script lo ha reso open source, in modo che i trader possano esaminarne e verificarne la funzionalità. Complimenti all'autore! Sebbene sia possibile utilizzarlo gratuitamente, ricordiamo che la ripubblicazione del codice è soggetta al nostro Regolamento.

Declinazione di responsabilità
Le informazioni e le pubblicazioni non sono intese come, e non costituiscono, consulenza o raccomandazioni finanziarie, di investimento, di trading o di altro tipo fornite o approvate da TradingView. Per ulteriori informazioni, consultare i Termini di utilizzo.
Script open-source
Nello spirito di TradingView, l'autore di questo script lo ha reso open source, in modo che i trader possano esaminarne e verificarne la funzionalità. Complimenti all'autore! Sebbene sia possibile utilizzarlo gratuitamente, ricordiamo che la ripubblicazione del codice è soggetta al nostro Regolamento.
Declinazione di responsabilità
Le informazioni e le pubblicazioni non sono intese come, e non costituiscono, consulenza o raccomandazioni finanziarie, di investimento, di trading o di altro tipo fornite o approvate da TradingView. Per ulteriori informazioni, consultare i Termini di utilizzo.