Aggiornato
Open Legacy Scoreboard
OPEN LEGACY SCOREBOARD
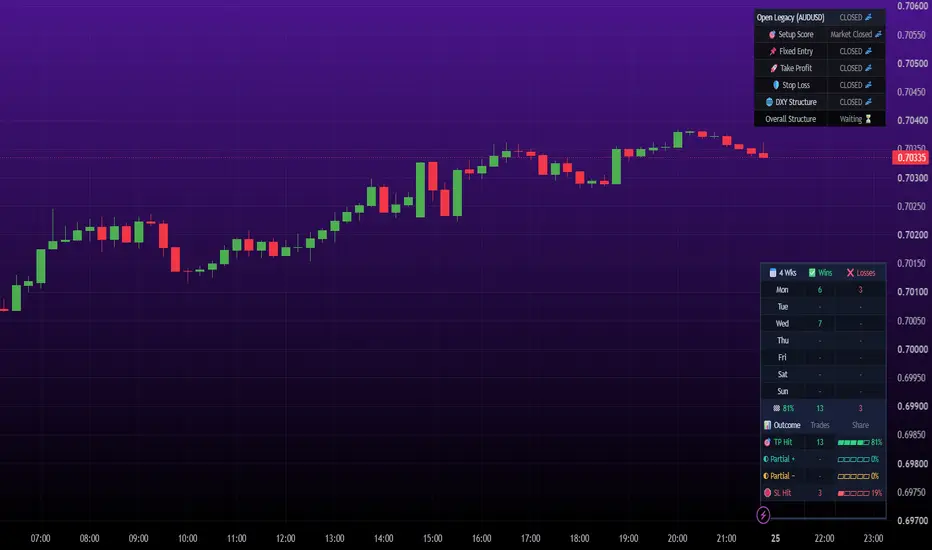
Open Legacy Scoreboard is a results tracker for manual traders who use the Open Legacy indicator. It replays the same BUY and SELL signals with your sessions, news blackouts and pip-based take profit and stop loss. It then counts how each trade would have ended, so you can review results by day, session and week without running a strategy.
HOW IT WORKS WITH OPEN LEGACY
It uses the same engine as the Open Legacy indicator and Open Legacy Bot: the same Entry Method (FVG Pullback or EMA Trend) and the same Sensitivity filter (Aggressive, Balanced, Conservative). Use the same settings as your indicator, and the scoreboard tracks the signals you see. You don't need it if you use Open Legacy Bot, which has the scoreboard built in.
HOW TRADES ARE REPLAYED
• A trade opens at the close of a signal candle, inside one of your sessions and outside any news blackout.
• One trade at a time. An opposite signal closes the open trade and opens the new one.
• From the next candle on, it checks whether the take profit or stop loss was reached. If one candle touches both, it uses 1-minute data to decide which came first.
• Trades can close at session end, and a trade closes when a news blackout starts.
HOW RESULTS ARE COUNTED
• TP Hit: the take profit was reached.
• SL Hit: the stop loss was reached.
• Partial +: closed early in profit (session end, blackout or reversal).
• Partial -: closed early at a loss.
TP Hit and Partial + count as wins. SL Hit and Partial - count as losses.
THE TABLE
• Wins and losses for each weekday, split by Session 1 and Session 2, with today highlighted.
• Totals and an overall win %.
• An outcome breakdown showing how many trades ended each way, with each outcome's share.
• Show Results For: This Week, Last Week, 2-4 Weeks Ago, Last 2/4/8/12 Weeks, or All Time.
• Optional chart markers show each counted entry and where it settled.
SETTINGS
• Strategy: Entry Method, Sensitivity, and an optional timeframe lock.
• Sessions: up to two sessions, each with its own days (Mon-Fri, Tue-Fri, single days, weekends and more), your timezone, and close-at-session-end.
• News Blackouts: up to three event times, with minutes either side.
• Targets: Stop Loss and Take Profit in pips, plus Points Per Pip (10 suits gold, indices, BTC and 5-decimal FX).
• Display: show or hide the scoreboard, choose the period, and turn trade markers on or off.
LIMITATIONS
• This is a replay, not live trading. It assumes fills at the candle close with no spread, slippage or commission, so real results will differ.
• Weeks and days follow the Timezone setting.
• It only counts trades within the chart history TradingView has loaded. The 1-minute data used to break ties also has limited history on very long charts.
• Older trade markers can drop off the chart because of TradingView's label limit. The table totals are not affected.
• Past results don't predict future results.
This script is for education and review. It is not financial advice. Test on a demo account first.
Open Legacy Scoreboard is a results tracker for manual traders who use the Open Legacy indicator. It replays the same BUY and SELL signals with your sessions, news blackouts and pip-based take profit and stop loss. It then counts how each trade would have ended, so you can review results by day, session and week without running a strategy.
HOW IT WORKS WITH OPEN LEGACY
It uses the same engine as the Open Legacy indicator and Open Legacy Bot: the same Entry Method (FVG Pullback or EMA Trend) and the same Sensitivity filter (Aggressive, Balanced, Conservative). Use the same settings as your indicator, and the scoreboard tracks the signals you see. You don't need it if you use Open Legacy Bot, which has the scoreboard built in.
HOW TRADES ARE REPLAYED
• A trade opens at the close of a signal candle, inside one of your sessions and outside any news blackout.
• One trade at a time. An opposite signal closes the open trade and opens the new one.
• From the next candle on, it checks whether the take profit or stop loss was reached. If one candle touches both, it uses 1-minute data to decide which came first.
• Trades can close at session end, and a trade closes when a news blackout starts.
HOW RESULTS ARE COUNTED
• TP Hit: the take profit was reached.
• SL Hit: the stop loss was reached.
• Partial +: closed early in profit (session end, blackout or reversal).
• Partial -: closed early at a loss.
TP Hit and Partial + count as wins. SL Hit and Partial - count as losses.
THE TABLE
• Wins and losses for each weekday, split by Session 1 and Session 2, with today highlighted.
• Totals and an overall win %.
• An outcome breakdown showing how many trades ended each way, with each outcome's share.
• Show Results For: This Week, Last Week, 2-4 Weeks Ago, Last 2/4/8/12 Weeks, or All Time.
• Optional chart markers show each counted entry and where it settled.
SETTINGS
• Strategy: Entry Method, Sensitivity, and an optional timeframe lock.
• Sessions: up to two sessions, each with its own days (Mon-Fri, Tue-Fri, single days, weekends and more), your timezone, and close-at-session-end.
• News Blackouts: up to three event times, with minutes either side.
• Targets: Stop Loss and Take Profit in pips, plus Points Per Pip (10 suits gold, indices, BTC and 5-decimal FX).
• Display: show or hide the scoreboard, choose the period, and turn trade markers on or off.
LIMITATIONS
• This is a replay, not live trading. It assumes fills at the candle close with no spread, slippage or commission, so real results will differ.
• Weeks and days follow the Timezone setting.
• It only counts trades within the chart history TradingView has loaded. The 1-minute data used to break ties also has limited history on very long charts.
• Older trade markers can drop off the chart because of TradingView's label limit. The table totals are not affected.
• Past results don't predict future results.
This script is for education and review. It is not financial advice. Test on a demo account first.
Note di rilascio
Bug fixes...Note di rilascio
OPEN LEGACY SCOREBOARDOpen Legacy Scoreboard is a results tracker for traders who use the Open Legacy indicator. It replays the indicator's BUY and SELL signals with the same strategy, sessions, news pauses and pip-based take profit and stop loss. It then counts how each trade ended, so you can review results by day and week without running a strategy.
HOW IT WORKS WITH OPEN LEGACY
It uses the same signal engine as the Open Legacy indicator: the same Entry Method (FVG Pullback or EMA Trend), Sensitivity filter, two sessions with their own days, and two news pauses. Use the same settings as your indicator, and the scoreboard tracks the trades you see on the chart.
HOW TRADES ARE REPLAYED
- A trade opens at the close of a signal candle.
- One trade at a time. A signal in the same direction is ignored while a trade is open, and an opposite signal closes it and opens the new one.
- From the next candle on, it checks whether TP or SL was reached. If one candle touches both, it uses 1-minute data to decide which came first.
HOW RESULTS ARE COUNTED
- TP Hit: the take profit was reached.
- SL Hit: the stop loss was reached.
- Partial +: closed early in profit by an opposite signal.
- Partial -: closed early at a loss by an opposite signal.
TP Hit and Partial + count as wins. SL Hit and Partial - count as losses.
THE TABLE
- Wins and losses for each weekday, with today highlighted.
- Totals and an overall win %.
- An outcome breakdown showing how many trades ended each way, with each outcome's share.
- Show Results For: This Week, Last Week, 2-4 Weeks Ago, Last 2/4/8/12 Weeks, or All Time.
- Optional chart markers show each counted entry and where it settled.
SETTINGS
- Strategy: Entry Method and Sensitivity.
- Targets: Stop Loss and Take Profit in pips, plus Points Per Pip (10 suits gold, indices, BTC and 5-decimal FX).
- Filters: Session 1 and Session 2 (each with its own hours and days), News 1 and News 2 (date and time) with the minutes to pause either side, and your Timezone.
- Display: show or hide the table, choose the period, and turn trade markers on or off.
LIMITATIONS
- This is a replay, not live trading. It assumes fills at the candle close with no spread, slippage or commission, so real results will differ.
- It only counts trades within the chart history TradingView has loaded. The 1-minute data used to break ties also has limited history on long charts.
- Older trade markers can drop off the chart because of TradingView's label limit. The table totals are not affected.
- Weeks and days follow the Timezone setting.
- Past results don't predict future results.
This script is for education and review. It is not financial advice. Test on a demo account first.
Note di rilascio
Bug fixes, with additional improvements!
Declinazione di responsabilità
Le informazioni e le pubblicazioni non sono intese come, e non costituiscono, consulenza o raccomandazioni finanziarie, di investimento, di trading o di altro tipo fornite o approvate da TradingView. Per ulteriori informazioni, consultare i Termini di utilizzo.
Declinazione di responsabilità
Le informazioni e le pubblicazioni non sono intese come, e non costituiscono, consulenza o raccomandazioni finanziarie, di investimento, di trading o di altro tipo fornite o approvate da TradingView. Per ulteriori informazioni, consultare i Termini di utilizzo.