OPEN-SOURCE SCRIPT
NSE F&O Option Scanner
How the Scoring Works (0–5 points)
Each condition adds 1 point:
✅ 8 EMA above 20 EMA (trend direction)
✅ OI Proxy confirms direction (Volume + Price interpretation)
✅ Sector index trading above its 20 EMA
✅ RSI not in extreme zone (not overbought for CE / not oversold for PE)
✅ Volume spike ≥ 1.5× the 20-bar average
Score ≥ 4 → High conviction signal → BUY CE or BUY PE label appears on chart
Score 3 → Weak setup — wait for confirmation
Score < 3 → No trade
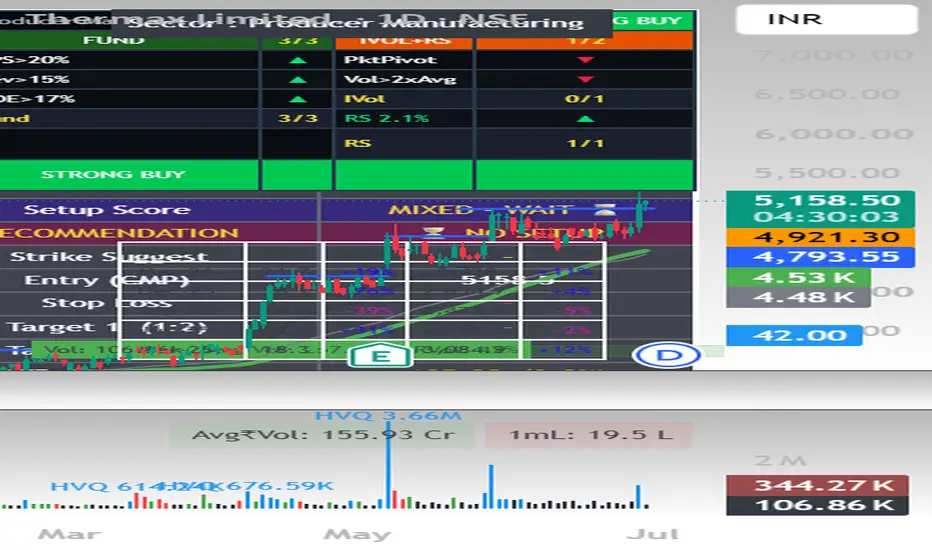
Dashboard Shows (top-right panel)
🔹 8/20 EMA trend + gap %
🔹 OI Proxy: Long Buildup / Short Buildup / Short Covering / Long Unwinding
🔹 Sector trend vs 20 EMA
🔹 Relative Strength vs sector (20-bar)
🔹 RSI (14) with overbought/oversold alert
🔹 MACD Histogram direction
🔹 Volume — Normal or Spike with multiplier
🔹 Setup Score (0–5)
🔹 Recommendation — 🟢 BUY CALL (CE) / 🔴 BUY PUT (PE) / ⏳ NO SETUP
🔹 Auto Strike Suggestion — ATM + 1 OTM (calculated from CMP)
🔹 Entry (CMP), Stop Loss, Target 1 (1:2), Target 2 (1:3)
🔹 ATR with volatility %
🔹 News reminder
How to Use
Add to any NSE F&O stock on Daily or 1H timeframe
Change the Sector Index input to match the stock — NIFTY_BANK, NIFTY_IT, NIFTY_AUTO, NIFTY_PHARMA, NIFTY_FMCG, NIFTY_METAL etc.
Read the dashboard — Score ≥ 4 = high conviction setup
Always verify news and catalyst on NSE website or Screener.in before entering
Set alerts using the 5 built-in alert conditions
Built-in Alerts
🟢 Strong BUY CE — EMA cross + OI + Sector all aligned (score ≥ 4)
🔴 Strong BUY PE — EMA cross + OI + Sector all aligned (score ≥ 4)
📊 EMA Bull Cross — 8 EMA crossed above 20 EMA
📊 EMA Bear Cross — 8 EMA crossed below 20 EMA
📈 Volume Spike in Bull Trend
Note on OI Data
For real open interest data, switch to the futures chart (e.g. NSE:RELIANCE1!). On equity charts this script uses Volume + Price direction as an OI proxy, which closely mirrors standard OI interpretation (Long Buildup, Short Buildup, Short Covering, Long Unwinding).
Settings
All parameters are adjustable — EMA lengths, ATR multiplier, Risk:Reward ratio, OI proxy sensitivity, and sector index. Tooltips explain each input.
⚠️ For educational and analysis purposes only. Not financial advice. Always use proper risk managemen
Each condition adds 1 point:
✅ 8 EMA above 20 EMA (trend direction)
✅ OI Proxy confirms direction (Volume + Price interpretation)
✅ Sector index trading above its 20 EMA
✅ RSI not in extreme zone (not overbought for CE / not oversold for PE)
✅ Volume spike ≥ 1.5× the 20-bar average
Score ≥ 4 → High conviction signal → BUY CE or BUY PE label appears on chart
Score 3 → Weak setup — wait for confirmation
Score < 3 → No trade
Dashboard Shows (top-right panel)
🔹 8/20 EMA trend + gap %
🔹 OI Proxy: Long Buildup / Short Buildup / Short Covering / Long Unwinding
🔹 Sector trend vs 20 EMA
🔹 Relative Strength vs sector (20-bar)
🔹 RSI (14) with overbought/oversold alert
🔹 MACD Histogram direction
🔹 Volume — Normal or Spike with multiplier
🔹 Setup Score (0–5)
🔹 Recommendation — 🟢 BUY CALL (CE) / 🔴 BUY PUT (PE) / ⏳ NO SETUP
🔹 Auto Strike Suggestion — ATM + 1 OTM (calculated from CMP)
🔹 Entry (CMP), Stop Loss, Target 1 (1:2), Target 2 (1:3)
🔹 ATR with volatility %
🔹 News reminder
How to Use
Add to any NSE F&O stock on Daily or 1H timeframe
Change the Sector Index input to match the stock — NIFTY_BANK, NIFTY_IT, NIFTY_AUTO, NIFTY_PHARMA, NIFTY_FMCG, NIFTY_METAL etc.
Read the dashboard — Score ≥ 4 = high conviction setup
Always verify news and catalyst on NSE website or Screener.in before entering
Set alerts using the 5 built-in alert conditions
Built-in Alerts
🟢 Strong BUY CE — EMA cross + OI + Sector all aligned (score ≥ 4)
🔴 Strong BUY PE — EMA cross + OI + Sector all aligned (score ≥ 4)
📊 EMA Bull Cross — 8 EMA crossed above 20 EMA
📊 EMA Bear Cross — 8 EMA crossed below 20 EMA
📈 Volume Spike in Bull Trend
Note on OI Data
For real open interest data, switch to the futures chart (e.g. NSE:RELIANCE1!). On equity charts this script uses Volume + Price direction as an OI proxy, which closely mirrors standard OI interpretation (Long Buildup, Short Buildup, Short Covering, Long Unwinding).
Settings
All parameters are adjustable — EMA lengths, ATR multiplier, Risk:Reward ratio, OI proxy sensitivity, and sector index. Tooltips explain each input.
⚠️ For educational and analysis purposes only. Not financial advice. Always use proper risk managemen
Script open-source
Nello spirito di TradingView, l'autore di questo script lo ha reso open source, in modo che i trader possano esaminarne e verificarne la funzionalità. Complimenti all'autore! Sebbene sia possibile utilizzarlo gratuitamente, ricordiamo che la ripubblicazione del codice è soggetta al nostro Regolamento.

Declinazione di responsabilità
Le informazioni e le pubblicazioni non sono intese come, e non costituiscono, consulenza o raccomandazioni finanziarie, di investimento, di trading o di altro tipo fornite o approvate da TradingView. Per ulteriori informazioni, consultare i Termini di utilizzo.
Script open-source
Nello spirito di TradingView, l'autore di questo script lo ha reso open source, in modo che i trader possano esaminarne e verificarne la funzionalità. Complimenti all'autore! Sebbene sia possibile utilizzarlo gratuitamente, ricordiamo che la ripubblicazione del codice è soggetta al nostro Regolamento.
Declinazione di responsabilità
Le informazioni e le pubblicazioni non sono intese come, e non costituiscono, consulenza o raccomandazioni finanziarie, di investimento, di trading o di altro tipo fornite o approvate da TradingView. Per ulteriori informazioni, consultare i Termini di utilizzo.