OPEN-SOURCE SCRIPT
Options Strikes
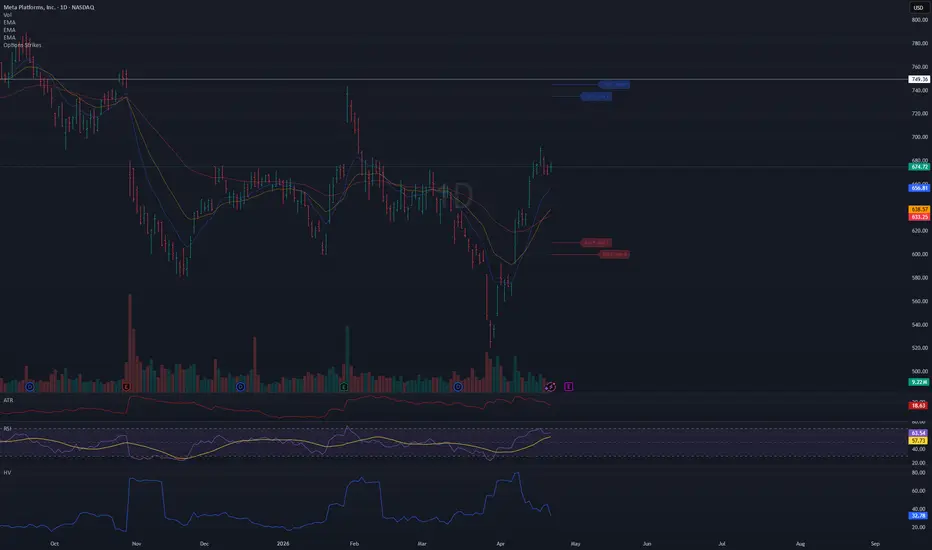
● Title: Options Strikes
Short description:
Visualize your open options positions on any chart — horizontal lines from entry to expiration, color-coded by Put/Call.
---
Full description:
Track up to 8 options contracts directly on your price chart. Each contract draws a horizontal line from your open date to the expiration date (4:00 PM ET), so you always see where your strikes sit relative to price and how much time is left.
Features
- Up to 8 contracts simultaneously — Put and Call
- Lines run from your open date to 4:00 PM ET on expiration day
- Puts in red, Calls in blue (colors and opacity customizable)
- Compact label at the end of each line: 610 P May 1
- Labels can be toggled on/off
- Calendar pickers for both Open date and Expiration date
- Auto-enable — a contract activates as soon as you enter a Strike value; set Strike to 0 to disable it
- Ticker filter — set a symbol (e.g. META) so lines only appear on that specific chart, useful when switching between
tickers
- Works on any symbol and any timeframe
How to use
1. Add the indicator to your chart
2. Open Settings → Inputs
3. For each contract: enter a Strike, select Type (Put/Call), pick Open date and Exp date
4. The line appears automatically — no need to toggle anything
5. Optionally set the Ticker field to lock this instance to a specific symbol
Tips
- Leave Ticker blank → lines show on every chart
- Open date defaults to today — change it only if you entered the position on a previous day
- To remove a contract, set its Strike back to 0
- Use contracts 5–8 for additional positions
- Adjust colors and line width in the Style group
Short description:
Visualize your open options positions on any chart — horizontal lines from entry to expiration, color-coded by Put/Call.
---
Full description:
Track up to 8 options contracts directly on your price chart. Each contract draws a horizontal line from your open date to the expiration date (4:00 PM ET), so you always see where your strikes sit relative to price and how much time is left.
Features
- Up to 8 contracts simultaneously — Put and Call
- Lines run from your open date to 4:00 PM ET on expiration day
- Puts in red, Calls in blue (colors and opacity customizable)
- Compact label at the end of each line: 610 P May 1
- Labels can be toggled on/off
- Calendar pickers for both Open date and Expiration date
- Auto-enable — a contract activates as soon as you enter a Strike value; set Strike to 0 to disable it
- Ticker filter — set a symbol (e.g. META) so lines only appear on that specific chart, useful when switching between
tickers
- Works on any symbol and any timeframe
How to use
1. Add the indicator to your chart
2. Open Settings → Inputs
3. For each contract: enter a Strike, select Type (Put/Call), pick Open date and Exp date
4. The line appears automatically — no need to toggle anything
5. Optionally set the Ticker field to lock this instance to a specific symbol
Tips
- Leave Ticker blank → lines show on every chart
- Open date defaults to today — change it only if you entered the position on a previous day
- To remove a contract, set its Strike back to 0
- Use contracts 5–8 for additional positions
- Adjust colors and line width in the Style group
Script open-source
Nello spirito di TradingView, l'autore di questo script lo ha reso open source, in modo che i trader possano esaminarne e verificarne la funzionalità. Complimenti all'autore! Sebbene sia possibile utilizzarlo gratuitamente, ricordiamo che la ripubblicazione del codice è soggetta al nostro Regolamento.

Declinazione di responsabilità
Le informazioni e le pubblicazioni non sono intese come, e non costituiscono, consulenza o raccomandazioni finanziarie, di investimento, di trading o di altro tipo fornite o approvate da TradingView. Per ulteriori informazioni, consultare i Termini di utilizzo.
Script open-source
Nello spirito di TradingView, l'autore di questo script lo ha reso open source, in modo che i trader possano esaminarne e verificarne la funzionalità. Complimenti all'autore! Sebbene sia possibile utilizzarlo gratuitamente, ricordiamo che la ripubblicazione del codice è soggetta al nostro Regolamento.
Declinazione di responsabilità
Le informazioni e le pubblicazioni non sono intese come, e non costituiscono, consulenza o raccomandazioni finanziarie, di investimento, di trading o di altro tipo fornite o approvate da TradingView. Per ulteriori informazioni, consultare i Termini di utilizzo.