OPEN-SOURCE SCRIPT
Aggiornato Opening Price Levels (by Period)
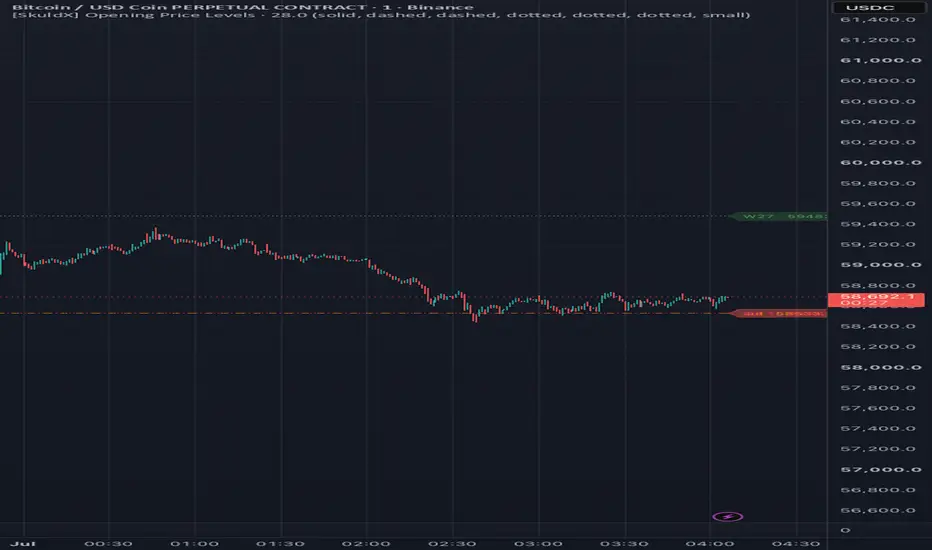
This indicator draws clean horizontal lines at the opening prices of key time periods: Year, Quarter, Month, Week, and Day.
Each line is plotted only within its own time range, so there's no visual clutter or vertical jumps between periods.
Perfect for traders who want to:
Identify and react to institutional levels.
Track price behavior relative to major opens.
Keep charts clean and easy to read.
Features:
✅ Toggle visibility for each period (Year, Quarter, Month, Week, Day).
🎯 Accurate open levels, aligned with your chart's timeframe and session settings.
✨ Clean segments — each line only spans its original period.
Each line is plotted only within its own time range, so there's no visual clutter or vertical jumps between periods.
Perfect for traders who want to:
Identify and react to institutional levels.
Track price behavior relative to major opens.
Keep charts clean and easy to read.
Features:
✅ Toggle visibility for each period (Year, Quarter, Month, Week, Day).
🎯 Accurate open levels, aligned with your chart's timeframe and session settings.
✨ Clean segments — each line only spans its original period.
Note di rilascio
Opening Price Levels (Multi-TF)This script draws opening price levels for different time periods on the chart. It allows you to display the opening price lines for the year, quarter, month, week, and day based on your selection.
Main Features:
Year Opening Level — A line representing the opening price for the current year.
Quarter Opening Level — A line representing the opening price for the current quarter.
Month Opening Level — A line representing the opening price for the current month.
Week Opening Level — A line representing the opening price for the current week.
Day Opening Level — A line representing the opening price for the current day.
Settings:
You can enable or disable the display of opening levels for each period (Year, Quarter, Month, Week, Day).
You can choose line colors for each period.
The lines are drawn only for the current period. For example, for the month — from the first day of the month to the current day, for the week — from the first day of the week to the current day, etc.
Line Display Mode:
The lines do not extend to the end of the chart, but stop at the current bar for each period.
The lines are drawn only for the first bar of the new period (e.g., at the start of a new month, quarter, year, etc.), allowing you to clearly track changes in opening levels.
This script helps you effectively track important levels on the chart, assisting in making informed trading decisions based on the opening prices of each significant period.
Note di rilascio
SkuldX Opening Price Levels — Multi-Timeframe Key Levelsby SkuldX Trading Systems
What is it?
SkuldX Opening Price Levels plots the opening prices of major time periods directly on your chart — giving you instant visibility into the key levels that institutional traders, algorithms, and market makers reference most. When price approaches these levels, expect reactions: retests, rejections, or breakouts.
What it plots
Year Open — the single most-watched level of the calendar year. Major support/resistance that often defines the macro bias for the entire year.
Quarter Open — Q1/Q2/Q3/Q4 opens. Heavily referenced by institutional flows at the start of each quarter.
Month Open — monthly level used by swing traders and funds for position entries and exits.
Week Open — short-term traders' primary reference. Price frequently returns to test the weekly open before continuing.
Day Open — intraday anchor level. Separates bullish and bearish intraday bias.
Prev Day Close — where the previous session ended. Gap analysis, overnight positioning, and session open behavior all reference this level.
Label system
Each line displays a dynamic label showing three pieces of information simultaneously:
Period Price Distance%
For example: Jan 94,500 +2.34%
The distance percentage updates in real time as price moves — so you always know exactly how far you are from each key level without manual calculation.
Settings
Each timeframe has its own independent group of settings:
Show — toggle visibility per timeframe
Color — independent color per level
Style — solid / dashed / dotted per level
The default style scheme is intentional — Year and Quarter use solid lines as the highest-priority levels, Month and Week use dashed, Day and Prev Close use dotted. This creates a natural visual hierarchy so the chart stays clean even with all levels active.
Notes
Works on any timeframe and any market. On lower timeframes (1m–15m) the Day Open and Prev Close are the most actionable levels. On higher timeframes (4h–1D) the Week, Month and Quarter opens become the primary reference points.
Built for SkuldX ecosystem
Opening levels are a core input to SkuldX bot logic — automated entries and exits are evaluated relative to these key price anchors across all timeframes.
Want your trading automated with session-aware logic?
Visit skuldxtrade.com to learn more about SkuldX Trading Systems.
Note di rilascio
UpdateScript open-source
Nello spirito di TradingView, l'autore di questo script lo ha reso open source, in modo che i trader possano esaminarne e verificarne la funzionalità. Complimenti all'autore! Sebbene sia possibile utilizzarlo gratuitamente, ricordiamo che la ripubblicazione del codice è soggetta al nostro Regolamento.

Visit skuldxtrade.com to learn more about SkuldX Trading Systems.
Declinazione di responsabilità
Le informazioni e le pubblicazioni non sono intese come, e non costituiscono, consulenza o raccomandazioni finanziarie, di investimento, di trading o di altro tipo fornite o approvate da TradingView. Per ulteriori informazioni, consultare i Termini di utilizzo.
Script open-source
Nello spirito di TradingView, l'autore di questo script lo ha reso open source, in modo che i trader possano esaminarne e verificarne la funzionalità. Complimenti all'autore! Sebbene sia possibile utilizzarlo gratuitamente, ricordiamo che la ripubblicazione del codice è soggetta al nostro Regolamento.
Visit skuldxtrade.com to learn more about SkuldX Trading Systems.
Declinazione di responsabilità
Le informazioni e le pubblicazioni non sono intese come, e non costituiscono, consulenza o raccomandazioni finanziarie, di investimento, di trading o di altro tipo fornite o approvate da TradingView. Per ulteriori informazioni, consultare i Termini di utilizzo.