Quanty | Trend Candles
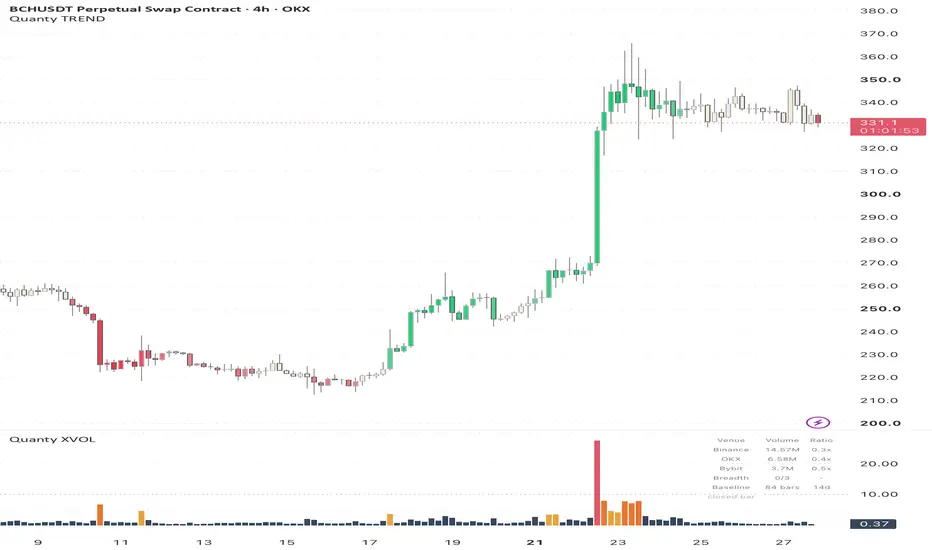
Most trend colouring is binary: a candle is green or red depending on which side of a moving average or a Supertrend line price sits on. That hides the question that matters, which is how much evidence there is that a trend exists at all. In a range, a binary tool keeps flipping between green and red; in a strong trend, it paints the same green as a weak one. This script colours every candle by the direction and the strength of the trend it sits in, and lets indecision look like indecision.
HOW IT IS CALCULATED
Momentum is the average of a fast and a slow exponential average of log returns (8 and 13 bars by default). Log returns make the reading independent of price level.
That momentum is then measured against what a trendless market with the same volatility would produce by chance. Volatility comes from a long window of squared returns, and the random-walk expectation is derived from the two averaging windows themselves. The result is a z-score: around 1 is ordinary noise, around 2 is a probable trend, 3 and above is a clear one. Because the reading is calibrated to each market's own noise, the same setting means the same thing on a large cap and on a thinly traded altcoin, on 15 minutes and on the daily chart.
Volume confirms, it does not create the signal. The script measures the volume-weighted share of recent bars that moved with the trend, adjusted for the effective number of bars so that one very large candle cannot fake broad participation. A move carried by many bars keeps its full colour; a move made on one thin candle fades. On symbols without volume data, bars are simply counted.
The evidence is passed through a soft S-curve, so readings below about one deviation stay near zero and strong evidence saturates toward full colour, then lightly smoothed.
READING IT
The candle stays in the neutral tone (cream or yellow) while the score is inside the indecision band. Past the band it switches to a clear trend colour and deepens as the evidence grows. A pullback inside a trend lightens the colour before it can turn it, because the fast and slow horizons disagree and partly cancel.
The score, the momentum evidence and the volume support are shown in the Data Window. Alerts fire when a trend turns strong in either direction and when a strong trend fades; they re-arm only after the score has clearly left the level, so they do not repeat while it hovers.
SETTINGS
Sensitivity sets how much evidence it takes to colour a candle. Aggressive shows more colour and more false tints in ranges; Conservative keeps ranges cleaner and colours trends later. Palette, indecision tone, band width and contrast change the look only, not the score.
NOTES AND LIMITATIONS
The colour describes the trend that exists; it does not forecast one. Strength is evidence, not speed: a steady low-volatility climb can read stronger than a violent rally of the same size.
After a sharp reversal the colour needs a few bars to reach full strength in the new direction. That is the price of keeping ranges quiet.
A parabolic move reads as the strongest trend right up to its top. Strength says nothing about how late a trend is.
By default the live candle is not coloured until it closes, so nothing repaints. Turning that off colours the forming candle, which can change until the close.
HOW IT IS CALCULATED
Momentum is the average of a fast and a slow exponential average of log returns (8 and 13 bars by default). Log returns make the reading independent of price level.
That momentum is then measured against what a trendless market with the same volatility would produce by chance. Volatility comes from a long window of squared returns, and the random-walk expectation is derived from the two averaging windows themselves. The result is a z-score: around 1 is ordinary noise, around 2 is a probable trend, 3 and above is a clear one. Because the reading is calibrated to each market's own noise, the same setting means the same thing on a large cap and on a thinly traded altcoin, on 15 minutes and on the daily chart.
Volume confirms, it does not create the signal. The script measures the volume-weighted share of recent bars that moved with the trend, adjusted for the effective number of bars so that one very large candle cannot fake broad participation. A move carried by many bars keeps its full colour; a move made on one thin candle fades. On symbols without volume data, bars are simply counted.
The evidence is passed through a soft S-curve, so readings below about one deviation stay near zero and strong evidence saturates toward full colour, then lightly smoothed.
READING IT
The candle stays in the neutral tone (cream or yellow) while the score is inside the indecision band. Past the band it switches to a clear trend colour and deepens as the evidence grows. A pullback inside a trend lightens the colour before it can turn it, because the fast and slow horizons disagree and partly cancel.
The score, the momentum evidence and the volume support are shown in the Data Window. Alerts fire when a trend turns strong in either direction and when a strong trend fades; they re-arm only after the score has clearly left the level, so they do not repeat while it hovers.
SETTINGS
Sensitivity sets how much evidence it takes to colour a candle. Aggressive shows more colour and more false tints in ranges; Conservative keeps ranges cleaner and colours trends later. Palette, indecision tone, band width and contrast change the look only, not the score.
NOTES AND LIMITATIONS
The colour describes the trend that exists; it does not forecast one. Strength is evidence, not speed: a steady low-volatility climb can read stronger than a violent rally of the same size.
After a sharp reversal the colour needs a few bars to reach full strength in the new direction. That is the price of keeping ranges quiet.
A parabolic move reads as the strongest trend right up to its top. Strength says nothing about how late a trend is.
By default the live candle is not coloured until it closes, so nothing repaints. Turning that off colours the forming candle, which can change until the close.

Declinazione di responsabilità
Le informazioni e le pubblicazioni non sono intese come, e non costituiscono, consulenza o raccomandazioni finanziarie, di investimento, di trading o di altro tipo fornite o approvate da TradingView. Per ulteriori informazioni, consultare i Termini di utilizzo.
Declinazione di responsabilità
Le informazioni e le pubblicazioni non sono intese come, e non costituiscono, consulenza o raccomandazioni finanziarie, di investimento, di trading o di altro tipo fornite o approvate da TradingView. Per ulteriori informazioni, consultare i Termini di utilizzo.