OPEN-SOURCE SCRIPT
MACD Mean Reversion Shading
MACD Mean Reversion Shading
This indicator is a visual MACD tool designed to make MACD/signal-line momentum shifts easier to read at a glance.
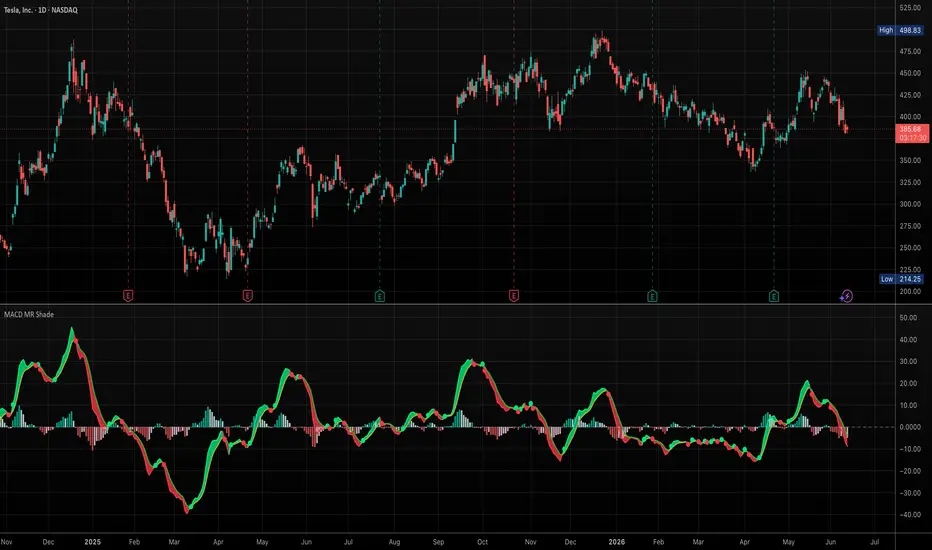
Unlike a standard MACD display that only plots the MACD line, signal line, and histogram, this version emphasizes the relationship between the MACD and signal line by coloring the MACD line, plotting optional crossover dots, and shading the space between the MACD and signal line.
The purpose is to help traders quickly identify potential mean-reversion momentum turns after extended moves, especially when MACD begins crossing back toward the signal line.
How it works
The indicator calculates MACD using customizable EMA lengths. The default settings are:
Fast EMA: 8
Slow EMA: 21
Signal EMA: 5
These faster settings are designed to be more responsive than the traditional 12/26/9 MACD.
When the MACD line is above the signal line, the indicator colors the MACD line green and shades the area between the two lines green. When the MACD line is below the signal line, the MACD line turns red and the shaded area turns red.
Optional dots mark MACD/signal-line crossovers:
Green dot: MACD crosses above the signal line
Red dot: MACD crosses below the signal line
The histogram can be displayed using either two-color or four-color logic. The four-color mode distinguishes between rising/falling momentum above and below the zero line.
Multi-timeframe option
The script can calculate MACD using the current chart timeframe or an alternate user-selected timeframe. This allows traders to view higher- or lower-timeframe MACD behavior while staying on the current chart.
How to use it
This script is not intended to be a standalone buy/sell system. It is designed as a visual momentum and mean-reversion aid.
Potential uses include:
Spotting MACD/signal-line turns after extended directional moves
Identifying when bearish momentum is weakening
Identifying when bullish momentum is strengthening
Comparing MACD momentum across different chart timeframes
Using the shaded MACD/signal area as a quick visual trend/momentum filter
A green shaded region suggests MACD is above its signal line. A red shaded region suggests MACD is below its signal line. Traders should combine this with price structure, support/resistance, trend, volume, and broader market context.
Original contribution
The main contribution of this script is its visual treatment of MACD/signal-line interaction: dynamic line coloring, shaded MACD/signal spread, crossover dots, four-color histogram behavior, and optional multi-timeframe calculation in one configurable tool.
This indicator is a visual MACD tool designed to make MACD/signal-line momentum shifts easier to read at a glance.
Unlike a standard MACD display that only plots the MACD line, signal line, and histogram, this version emphasizes the relationship between the MACD and signal line by coloring the MACD line, plotting optional crossover dots, and shading the space between the MACD and signal line.
The purpose is to help traders quickly identify potential mean-reversion momentum turns after extended moves, especially when MACD begins crossing back toward the signal line.
How it works
The indicator calculates MACD using customizable EMA lengths. The default settings are:
Fast EMA: 8
Slow EMA: 21
Signal EMA: 5
These faster settings are designed to be more responsive than the traditional 12/26/9 MACD.
When the MACD line is above the signal line, the indicator colors the MACD line green and shades the area between the two lines green. When the MACD line is below the signal line, the MACD line turns red and the shaded area turns red.
Optional dots mark MACD/signal-line crossovers:
Green dot: MACD crosses above the signal line
Red dot: MACD crosses below the signal line
The histogram can be displayed using either two-color or four-color logic. The four-color mode distinguishes between rising/falling momentum above and below the zero line.
Multi-timeframe option
The script can calculate MACD using the current chart timeframe or an alternate user-selected timeframe. This allows traders to view higher- or lower-timeframe MACD behavior while staying on the current chart.
How to use it
This script is not intended to be a standalone buy/sell system. It is designed as a visual momentum and mean-reversion aid.
Potential uses include:
Spotting MACD/signal-line turns after extended directional moves
Identifying when bearish momentum is weakening
Identifying when bullish momentum is strengthening
Comparing MACD momentum across different chart timeframes
Using the shaded MACD/signal area as a quick visual trend/momentum filter
A green shaded region suggests MACD is above its signal line. A red shaded region suggests MACD is below its signal line. Traders should combine this with price structure, support/resistance, trend, volume, and broader market context.
Original contribution
The main contribution of this script is its visual treatment of MACD/signal-line interaction: dynamic line coloring, shaded MACD/signal spread, crossover dots, four-color histogram behavior, and optional multi-timeframe calculation in one configurable tool.
Script open-source
Nello spirito di TradingView, l'autore di questo script lo ha reso open source, in modo che i trader possano esaminarne e verificarne la funzionalità. Complimenti all'autore! Sebbene sia possibile utilizzarlo gratuitamente, ricordiamo che la ripubblicazione del codice è soggetta al nostro Regolamento.

Declinazione di responsabilità
Le informazioni e le pubblicazioni non sono intese come, e non costituiscono, consulenza o raccomandazioni finanziarie, di investimento, di trading o di altro tipo fornite o approvate da TradingView. Per ulteriori informazioni, consultare i Termini di utilizzo.
Script open-source
Nello spirito di TradingView, l'autore di questo script lo ha reso open source, in modo che i trader possano esaminarne e verificarne la funzionalità. Complimenti all'autore! Sebbene sia possibile utilizzarlo gratuitamente, ricordiamo che la ripubblicazione del codice è soggetta al nostro Regolamento.
Declinazione di responsabilità
Le informazioni e le pubblicazioni non sono intese come, e non costituiscono, consulenza o raccomandazioni finanziarie, di investimento, di trading o di altro tipo fornite o approvate da TradingView. Per ulteriori informazioni, consultare i Termini di utilizzo.