OPEN-SOURCE SCRIPT
Momentum Ignition - SMI + Squeeze Momentum
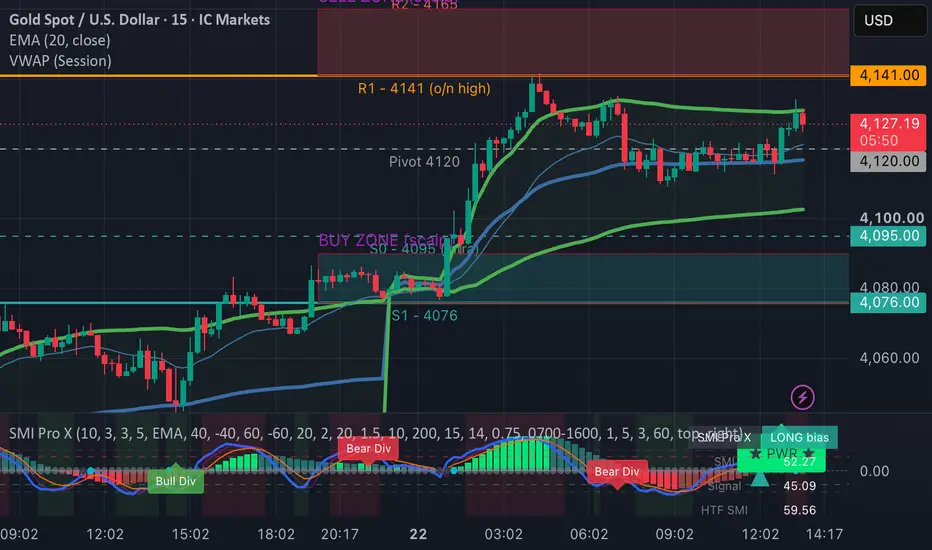
Overview
Momentum Ignition merges two of the most respected concepts in technical analysis — the Stochastic Momentum Index (SMI) by William Blau and the Squeeze Momentum Indicator by LazyBear (which is itself a Pine Script implementation of John Carter's TTM Squeeze). Neither indicator on its own answers the two questions a trader actually needs answered on every signal:
Which way is momentum turning? → SMI answers this.
Is the market actually about to move, or is this just noise inside a range? → Squeeze Momentum answers this.
Momentum Ignition combines them into a single-pane oscillator that produces a Power Signal only when both agree, and gives you a full read on the market state at a glance via a live info table.
The indicator is fully configurable, non-repainting on higher-timeframe confirmation, and includes multiple filters designed specifically to reduce false signals on low-timeframe charts (1m/3m/5m).
Why this pairing works
The Stochastic Momentum Index (Blau, 1993) is a double-smoothed refinement of the classic Stochastic. Instead of measuring where price sits within a range, it measures where price sits relative to the midpoint of that range, then double-smooths the result. This produces a cleaner, less-noisy oscillator that oscillates between -100 and +100 with much less whipsaw than the standard Stochastic.
The Squeeze Momentum Indicator (LazyBear's version of John Carter's TTM Squeeze) does something completely different — it detects volatility compression by checking whether the Bollinger Bands are contained inside the Keltner Channels. When they are, the market is coiled. When they expand back out, the squeeze "fires" — historically the beginning of the largest directional moves.
Neither indicator sees what the other sees. SMI can flash a beautiful cross in the middle of a dead range. The Squeeze can fire while momentum is still ambiguous. Combined, you get:
SMI = trade direction and momentum
Squeeze = permission to take the trade (or not)
The Power Signal requires both to align.
Components on the chart
1. SMI + Signal + HTF SMI (three lines)
Blue line — SMI on the current timeframe
Orange line — Signal (smoothed SMI)
Purple line — SMI computed on a user-selected higher timeframe (default 15-minute). Non-repainting.
2. Squeeze Momentum histogram (4-color)
Plotted as columns behind the SMI lines. Colors follow LazyBear's convention:
Bright lime — momentum positive AND rising (bull accelerating)
Dim green — momentum positive but falling (bull fading)
Bright red — momentum negative AND falling (bear accelerating)
Dim maroon — momentum negative but rising (bear fading)
The histogram is normalized to the ±100 SMI scale by default so it fits cleanly in the pane.
3. Squeeze state dot (on zero-line)
A small colored dot printed at zero on every bar. This is the key visual for reading market state:
Black — squeeze is ON (coiled). Wait, don't chase.
Aqua — squeeze just FIRED this bar. Move imminent.
Gray — squeeze is off (released).
Faint gray — no squeeze / idle.
4. Overbought / Oversold zones
Dashed horizontal lines at ±40 (default) and ±60 (extreme). When SMI enters these zones, background shading turns green/red to make it obvious.
5. Signals
Two tiers, so you can visually distinguish the strongest setups:
Small BUY / SELL triangles — regular SMI cross that passes all standard filters.
★ PWR ★ labels — the Power Signal. Regular signal PLUS squeeze alignment PLUS momentum direction agreement. These are the "everything is lined up" trades.
6. Divergences
Optional. Regular bull/bear divergences between price and SMI are marked with labels at the pivot bar.
7. Info table
Top-right corner (position adjustable). Live snapshot of every state variable that matters:
Overall bias (LONG / SHORT / Recovering / Fading)
SMI value, Signal value, HTF SMI value
Squeeze state (COILED / FIRED! / Fresh Fire / Released / Idle)
Momentum direction (Bull accel / Bear accel / Bull fade / Bear fade)
Trend state (UP / DOWN)
Volatility filter status (yes / no)
How to use it
The core workflow
Step 1 — Read the squeeze dot.
Row of black dots = market is coiled. Sit on your hands. Do not enter random signals in a squeeze.
Dot turns aqua = the squeeze just fired. A move is now much more likely.
Step 2 — Check the histogram color the moment the fire event happens.
Bright lime bars = the release is bullish.
Bright red bars = the release is bearish.
The color tells you which side to look for.
Step 3 — Wait for the SMI cross in that direction.
If the fire is bullish, look for SMI to cross above Signal (and ideally still be below the overbought zone).
If the fire is bearish, look for SMI to cross below Signal (and ideally still be above the oversold zone).
Step 4 — Take the ★ PWR ★ signal.
When all conditions are met, the label prints. This is the strongest setup the indicator produces.
Regular BUY/SELL triangles are also valid but lower conviction — treat them as "the direction is right but the market isn't necessarily ready to move yet."
Reading the info table for quick context
Glance at the table for a 5-second read of the market state:
Squeeze = COILED, Momentum = Bull accel → be patient, prepare to buy the fire.
Squeeze = FIRED!, Momentum = Bull accel, Trend = UP → primary long conditions.
Squeeze = Idle, Momentum = Bear fade → range environment, low conviction either way.
Squeeze = Released, Momentum = Bear accel → active downside move, don't fade it.
Divergences
Regular divergences are early warning of trend exhaustion. They are best combined with the squeeze/momentum picture:
Bear divergence + squeeze fires bearish = high-quality short reversal setup.
Bull divergence + squeeze fires bullish = high-quality long reversal setup.
Divergence alone during a squeeze (no fire yet) means nothing until the squeeze resolves.
Settings guide
SMI Calculation
%K Length (10): Lookback for the high/low range. Lower = faster, more signals. Higher = smoother.
%D Length (3), %DD Length (3): First and second smoothing periods. Blau's original is 3/3.
Signal Length (5): EMA of the SMI for cross signals.
Smoothing MA (EMA): SMA / EMA / WMA / RMA / HMA / TEMA / DEMA. TEMA reduces lag noticeably without adding much noise — good default for low timeframes.
Levels
Overbought / Oversold (±40): Signal-blocking zones. Default is more sensitive than a standard Stochastic (±80/20) because SMI's double smoothing spends more time in the middle.
Extreme (±60): Visual reference for aggressive OB/OS.
Squeeze Momentum
BB Length (20), BB StdDev (2.0): Bollinger Band settings.
KC Length (20), KC Range Mult (1.5): Keltner Channel settings. 1.5 = TTM standard (tighter, more fires). 2.0 = LazyBear default (looser, fewer but stronger fires).
Use TrueRange: LazyBear's original uses TR; TTM's original uses high-low. TR is more responsive.
Bars after fire = 'fresh' (10): How long after a squeeze fires the "fresh fire" flag stays active for Power Signal purposes.
Show / normalize histogram: Toggle and scale the histogram.
Signal Filters (built for low-timeframe noise)
Trend Filter (EMA200): Longs only above the trend EMA, shorts only below. Kills counter-trend signals.
HTF Confirmation (15m default): Signal only fires if the higher-timeframe SMI agrees on direction. Non-repainting — uses the previous closed HTF bar.
ATR Volatility Filter (0.75x): Requires current ATR to be at least 75% of its own 50-period SMA. Skips signals when volatility is too low to move price meaningfully.
Session Filter (07:00–16:00 default): Optional. Only signal during high-liquidity hours.
Confirmation Bars (1): Cross must hold for N consecutive bars before firing. Set to 2 or 3 on 1m for fewer false signals.
Divergence
Standard pivot-based lookback settings. Increase pivot lookback for stronger, less frequent divergences.
Visuals
Toggle histogram source, OB/OS shading, info table, table position.
Recommended presets
Gold / FX on 1-minute
SMI: 10 / 3 / 3 / 5, TEMA smoothing
Squeeze: BB 20/2.0, KC 20/1.5, TrueRange ON
HTF: 15m
Trend: EMA 200 ON
ATR: 0.75x ON
Confirm: 2 bars
Session: OFF (or 0700–1600 exchange time)
Stocks on 5-minute
SMI: 13 / 5 / 3 / 5, EMA
Squeeze: BB 20/2.0, KC 20/2.0 (looser)
HTF: 1H
Trend: EMA 200 ON
Confirm: 1 bar
Crypto on 15-minute
SMI: 14 / 3 / 3 / 5, EMA
Squeeze: BB 20/2.0, KC 20/1.5
HTF: 4H
Trend: EMA 200 ON
ATR: OFF (crypto is usually volatile enough)
Session: OFF
Higher-timeframe swing (4H / Daily)
SMI: 21 / 5 / 3 / 8, EMA
Squeeze: BB 20/2.0, KC 20/2.0
HTF: 1D or 1W
Trend: EMA 200 ON
Confirm: 1 bar
Divergence: ON, lookbacks 7/5
Alerts
The indicator ships with nine ready-to-use alertconditions:
★ POWER LONG — highest-conviction long setup
★ POWER SHORT — highest-conviction short setup
Squeeze Fired — the moment volatility releases (worth setting on its own — pings you before the move even develops direction)
SMI Long / Short (regular) — standard SMI cross with filters, without squeeze confirmation
SMI zero-line UP / DOWN — macro momentum shift
Bullish / Bearish divergence — early reversal warning
Right-click the indicator → Add alert → Condition → Momentum Ignition → pick the event.
What makes this different from a stock SMI + separate Squeeze indicator
Anyone can drop LazyBear's Squeeze and a standard SMI on their chart. What this indicator adds:
Merged Power Signal logic — you don't have to eyeball whether the two agree; the indicator only fires when they do.
Non-repainting HTF confirmation — proper barmerge.lookahead_off with [1] offset. The signals you see in replay are the signals you would have seen live.
Volatility gating — the ATR filter kills the low-vol whipsaw signals that plague both indicators on lower timeframes.
Trend gating — no counter-trend signals unless you explicitly disable the filter.
Streak-based confirmation — configurable N-bar hold requirement before signal fires.
Selectable smoothing types — most SMI implementations lock you into EMA. TEMA in particular is significantly better on 1m charts.
Squeeze normalization — the Squeeze Momentum histogram is scaled to the SMI's ±100 range so both fit cleanly in one pane; no separate indicator needed.
Info table — instant read of every state variable without hunting through plot values.
Limitations
Not a strategy. This is an indicator, not a backtestable strategy. Signals are not entry/exit rules — they are conditions for you to evaluate against your own trade plan.
HTF confirmation adds lag. By design, the HTF filter waits for the higher-timeframe bar to close. This delays signals in exchange for reliability. Turn it off if you want purely current-TF signals.
Squeeze fires do not guarantee direction. A fire event means volatility is expanding, not which way. The Power Signal requires the histogram color to confirm direction — trust that requirement.
Low-volatility instruments and dead sessions produce weak fires. Use the ATR filter or the session filter to skip these.
Divergence detection uses closed pivots. Divergences confirm divLbR bars after the pivot forms. This is unavoidable for any pivot-based divergence method.
Credits
This indicator combines and extends two pieces of open-source work. Please credit the originals:
Stochastic Momentum Index — William Blau, Technical Analysis of Stocks & Commodities, January 1993.
Squeeze Momentum Indicator — LazyBear (TradingView profile). The squeeze detection and momentum linear-regression logic are adapted from LazyBear's original Pine implementation, which itself is based on John Carter's TTM Squeeze from Mastering the Trade (McGraw-Hill, 2005).
All additional logic — the Power Signal merge, HTF confirmation, filter stack, non-repainting security calls, info table, normalization, and multi-MA smoothing — is original to this indicator.
Disclaimer
This indicator is provided for educational and analytical purposes only. It is not financial advice. Nothing displayed by this indicator constitutes a recommendation to buy or sell any security. All trading involves risk, including the risk of losing all capital. Past performance and hypothetical results do not guarantee future returns. Do your own research and consult a licensed financial advisor before making investment decisions.Overview
Momentum Ignition merges two of the most respected concepts in technical analysis — the Stochastic Momentum Index (SMI) by William Blau and the Squeeze Momentum Indicator by LazyBear (which is itself a Pine Script implementation of John Carter's TTM Squeeze). Neither indicator on its own answers the two questions a trader actually needs answered on every signal:
Which way is momentum turning? → SMI answers this.
Is the market actually about to move, or is this just noise inside a range? → Squeeze Momentum answers this.
Momentum Ignition combines them into a single-pane oscillator that produces a Power Signal only when both agree, and gives you a full read on the market state at a glance via a live info table.
The indicator is fully configurable, non-repainting on higher-timeframe confirmation, and includes multiple filters designed specifically to reduce false signals on low-timeframe charts (1m/3m/5m).
Why this pairing works
The Stochastic Momentum Index (Blau, 1993) is a double-smoothed refinement of the classic Stochastic. Instead of measuring where price sits within a range, it measures where price sits relative to the midpoint of that range, then double-smooths the result. This produces a cleaner, less-noisy oscillator that oscillates between -100 and +100 with much less whipsaw than the standard Stochastic.
The Squeeze Momentum Indicator (LazyBear's version of John Carter's TTM Squeeze) does something completely different — it detects volatility compression by checking whether the Bollinger Bands are contained inside the Keltner Channels. When they are, the market is coiled. When they expand back out, the squeeze "fires" — historically the beginning of the largest directional moves.
Neither indicator sees what the other sees. SMI can flash a beautiful cross in the middle of a dead range. The Squeeze can fire while momentum is still ambiguous. Combined, you get:
SMI = trade direction and momentum
Squeeze = permission to take the trade (or not)
The Power Signal requires both to align.
Components on the chart
1. SMI + Signal + HTF SMI (three lines)
Blue line — SMI on the current timeframe
Orange line — Signal (smoothed SMI)
Purple line — SMI computed on a user-selected higher timeframe (default 15-minute). Non-repainting.
2. Squeeze Momentum histogram (4-color)
Plotted as columns behind the SMI lines. Colors follow LazyBear's convention:
Bright lime — momentum positive AND rising (bull accelerating)
Dim green — momentum positive but falling (bull fading)
Bright red — momentum negative AND falling (bear accelerating)
Dim maroon — momentum negative but rising (bear fading)
The histogram is normalized to the ±100 SMI scale by default so it fits cleanly in the pane.
3. Squeeze state dot (on zero-line)
A small colored dot printed at zero on every bar. This is the key visual for reading market state:
Black — squeeze is ON (coiled). Wait, don't chase.
Aqua — squeeze just FIRED this bar. Move imminent.
Gray — squeeze is off (released).
Faint gray — no squeeze / idle.
4. Overbought / Oversold zones
Dashed horizontal lines at ±40 (default) and ±60 (extreme). When SMI enters these zones, background shading turns green/red to make it obvious.
5. Signals
Two tiers, so you can visually distinguish the strongest setups:
Small BUY / SELL triangles — regular SMI cross that passes all standard filters.
★ PWR ★ labels — the Power Signal. Regular signal PLUS squeeze alignment PLUS momentum direction agreement. These are the "everything is lined up" trades.
6. Divergences
Optional. Regular bull/bear divergences between price and SMI are marked with labels at the pivot bar.
7. Info table
Top-right corner (position adjustable). Live snapshot of every state variable that matters:
Overall bias (LONG / SHORT / Recovering / Fading)
SMI value, Signal value, HTF SMI value
Squeeze state (COILED / FIRED! / Fresh Fire / Released / Idle)
Momentum direction (Bull accel / Bear accel / Bull fade / Bear fade)
Trend state (UP / DOWN)
Volatility filter status (yes / no)
How to use it
The core workflow
Step 1 — Read the squeeze dot.
Row of black dots = market is coiled. Sit on your hands. Do not enter random signals in a squeeze.
Dot turns aqua = the squeeze just fired. A move is now much more likely.
Step 2 — Check the histogram color the moment the fire event happens.
Bright lime bars = the release is bullish.
Bright red bars = the release is bearish.
The color tells you which side to look for.
Step 3 — Wait for the SMI cross in that direction.
If the fire is bullish, look for SMI to cross above Signal (and ideally still be below the overbought zone).
If the fire is bearish, look for SMI to cross below Signal (and ideally still be above the oversold zone).
Step 4 — Take the ★ PWR ★ signal.
When all conditions are met, the label prints. This is the strongest setup the indicator produces.
Regular BUY/SELL triangles are also valid but lower conviction — treat them as "the direction is right but the market isn't necessarily ready to move yet."
Reading the info table for quick context
Glance at the table for a 5-second read of the market state:
Squeeze = COILED, Momentum = Bull accel → be patient, prepare to buy the fire.
Squeeze = FIRED!, Momentum = Bull accel, Trend = UP → primary long conditions.
Squeeze = Idle, Momentum = Bear fade → range environment, low conviction either way.
Squeeze = Released, Momentum = Bear accel → active downside move, don't fade it.
Divergences
Regular divergences are early warning of trend exhaustion. They are best combined with the squeeze/momentum picture:
Bear divergence + squeeze fires bearish = high-quality short reversal setup.
Bull divergence + squeeze fires bullish = high-quality long reversal setup.
Divergence alone during a squeeze (no fire yet) means nothing until the squeeze resolves.
Settings guide
SMI Calculation
%K Length (10): Lookback for the high/low range. Lower = faster, more signals. Higher = smoother.
%D Length (3), %DD Length (3): First and second smoothing periods. Blau's original is 3/3.
Signal Length (5): EMA of the SMI for cross signals.
Smoothing MA (EMA): SMA / EMA / WMA / RMA / HMA / TEMA / DEMA. TEMA reduces lag noticeably without adding much noise — good default for low timeframes.
Levels
Overbought / Oversold (±40): Signal-blocking zones. Default is more sensitive than a standard Stochastic (±80/20) because SMI's double smoothing spends more time in the middle.
Extreme (±60): Visual reference for aggressive OB/OS.
Squeeze Momentum
BB Length (20), BB StdDev (2.0): Bollinger Band settings.
KC Length (20), KC Range Mult (1.5): Keltner Channel settings. 1.5 = TTM standard (tighter, more fires). 2.0 = LazyBear default (looser, fewer but stronger fires).
Use TrueRange: LazyBear's original uses TR; TTM's original uses high-low. TR is more responsive.
Bars after fire = 'fresh' (10): How long after a squeeze fires the "fresh fire" flag stays active for Power Signal purposes.
Show / normalize histogram: Toggle and scale the histogram.
Signal Filters (built for low-timeframe noise)
Trend Filter (EMA200): Longs only above the trend EMA, shorts only below. Kills counter-trend signals.
HTF Confirmation (15m default): Signal only fires if the higher-timeframe SMI agrees on direction. Non-repainting — uses the previous closed HTF bar.
ATR Volatility Filter (0.75x): Requires current ATR to be at least 75% of its own 50-period SMA. Skips signals when volatility is too low to move price meaningfully.
Session Filter (07:00–16:00 default): Optional. Only signal during high-liquidity hours.
Confirmation Bars (1): Cross must hold for N consecutive bars before firing. Set to 2 or 3 on 1m for fewer false signals.
Divergence
Standard pivot-based lookback settings. Increase pivot lookback for stronger, less frequent divergences.
Visuals
Toggle histogram source, OB/OS shading, info table, table position.
Recommended presets
Gold / FX on 1-minute
SMI: 10 / 3 / 3 / 5, TEMA smoothing
Squeeze: BB 20/2.0, KC 20/1.5, TrueRange ON
HTF: 15m
Trend: EMA 200 ON
ATR: 0.75x ON
Confirm: 2 bars
Session: OFF (or 0700–1600 exchange time)
Stocks on 5-minute
SMI: 13 / 5 / 3 / 5, EMA
Squeeze: BB 20/2.0, KC 20/2.0 (looser)
HTF: 1H
Trend: EMA 200 ON
Confirm: 1 bar
Crypto on 15-minute
SMI: 14 / 3 / 3 / 5, EMA
Squeeze: BB 20/2.0, KC 20/1.5
HTF: 4H
Trend: EMA 200 ON
ATR: OFF (crypto is usually volatile enough)
Session: OFF
Higher-timeframe swing (4H / Daily)
SMI: 21 / 5 / 3 / 8, EMA
Squeeze: BB 20/2.0, KC 20/2.0
HTF: 1D or 1W
Trend: EMA 200 ON
Confirm: 1 bar
Divergence: ON, lookbacks 7/5
Alerts
The indicator ships with nine ready-to-use alertconditions:
★ POWER LONG — highest-conviction long setup
★ POWER SHORT — highest-conviction short setup
Squeeze Fired — the moment volatility releases (worth setting on its own — pings you before the move even develops direction)
SMI Long / Short (regular) — standard SMI cross with filters, without squeeze confirmation
SMI zero-line UP / DOWN — macro momentum shift
Bullish / Bearish divergence — early reversal warning
Right-click the indicator → Add alert → Condition → Momentum Ignition → pick the event.
What makes this different from a stock SMI + separate Squeeze indicator
Anyone can drop LazyBear's Squeeze and a standard SMI on their chart. What this indicator adds:
Merged Power Signal logic — you don't have to eyeball whether the two agree; the indicator only fires when they do.
Non-repainting HTF confirmation — proper barmerge.lookahead_off with [1] offset. The signals you see in replay are the signals you would have seen live.
Volatility gating — the ATR filter kills the low-vol whipsaw signals that plague both indicators on lower timeframes.
Trend gating — no counter-trend signals unless you explicitly disable the filter.
Streak-based confirmation — configurable N-bar hold requirement before signal fires.
Selectable smoothing types — most SMI implementations lock you into EMA. TEMA in particular is significantly better on 1m charts.
Squeeze normalization — the Squeeze Momentum histogram is scaled to the SMI's ±100 range so both fit cleanly in one pane; no separate indicator needed.
Info table — instant read of every state variable without hunting through plot values.
Limitations
Not a strategy. This is an indicator, not a backtestable strategy. Signals are not entry/exit rules — they are conditions for you to evaluate against your own trade plan.
HTF confirmation adds lag. By design, the HTF filter waits for the higher-timeframe bar to close. This delays signals in exchange for reliability. Turn it off if you want purely current-TF signals.
Squeeze fires do not guarantee direction. A fire event means volatility is expanding, not which way. The Power Signal requires the histogram color to confirm direction — trust that requirement.
Low-volatility instruments and dead sessions produce weak fires. Use the ATR filter or the session filter to skip these.
Divergence detection uses closed pivots. Divergences confirm divLbR bars after the pivot forms. This is unavoidable for any pivot-based divergence method.
Credits
This indicator combines and extends two pieces of open-source work. Please credit the originals:
Stochastic Momentum Index — William Blau, Technical Analysis of Stocks & Commodities, January 1993.
Squeeze Momentum Indicator — LazyBear (TradingView profile). The squeeze detection and momentum linear-regression logic are adapted from LazyBear's original Pine implementation, which itself is based on John Carter's TTM Squeeze from Mastering the Trade (McGraw-Hill, 2005).
All additional logic — the Power Signal merge, HTF confirmation, filter stack, non-repainting security calls, info table, normalization, and multi-MA smoothing — is original to this indicator.
Disclaimer
This indicator is provided for educational and analytical purposes only. It is not financial advice. Nothing displayed by this indicator constitutes a recommendation to buy or sell any security. All trading involves risk, including the risk of losing all capital. Past performance and hypothetical results do not guarantee future returns. Do your own research and consult a licensed financial advisor before making investment decisions.
Momentum Ignition merges two of the most respected concepts in technical analysis — the Stochastic Momentum Index (SMI) by William Blau and the Squeeze Momentum Indicator by LazyBear (which is itself a Pine Script implementation of John Carter's TTM Squeeze). Neither indicator on its own answers the two questions a trader actually needs answered on every signal:
Which way is momentum turning? → SMI answers this.
Is the market actually about to move, or is this just noise inside a range? → Squeeze Momentum answers this.
Momentum Ignition combines them into a single-pane oscillator that produces a Power Signal only when both agree, and gives you a full read on the market state at a glance via a live info table.
The indicator is fully configurable, non-repainting on higher-timeframe confirmation, and includes multiple filters designed specifically to reduce false signals on low-timeframe charts (1m/3m/5m).
Why this pairing works
The Stochastic Momentum Index (Blau, 1993) is a double-smoothed refinement of the classic Stochastic. Instead of measuring where price sits within a range, it measures where price sits relative to the midpoint of that range, then double-smooths the result. This produces a cleaner, less-noisy oscillator that oscillates between -100 and +100 with much less whipsaw than the standard Stochastic.
The Squeeze Momentum Indicator (LazyBear's version of John Carter's TTM Squeeze) does something completely different — it detects volatility compression by checking whether the Bollinger Bands are contained inside the Keltner Channels. When they are, the market is coiled. When they expand back out, the squeeze "fires" — historically the beginning of the largest directional moves.
Neither indicator sees what the other sees. SMI can flash a beautiful cross in the middle of a dead range. The Squeeze can fire while momentum is still ambiguous. Combined, you get:
SMI = trade direction and momentum
Squeeze = permission to take the trade (or not)
The Power Signal requires both to align.
Components on the chart
1. SMI + Signal + HTF SMI (three lines)
Blue line — SMI on the current timeframe
Orange line — Signal (smoothed SMI)
Purple line — SMI computed on a user-selected higher timeframe (default 15-minute). Non-repainting.
2. Squeeze Momentum histogram (4-color)
Plotted as columns behind the SMI lines. Colors follow LazyBear's convention:
Bright lime — momentum positive AND rising (bull accelerating)
Dim green — momentum positive but falling (bull fading)
Bright red — momentum negative AND falling (bear accelerating)
Dim maroon — momentum negative but rising (bear fading)
The histogram is normalized to the ±100 SMI scale by default so it fits cleanly in the pane.
3. Squeeze state dot (on zero-line)
A small colored dot printed at zero on every bar. This is the key visual for reading market state:
Black — squeeze is ON (coiled). Wait, don't chase.
Aqua — squeeze just FIRED this bar. Move imminent.
Gray — squeeze is off (released).
Faint gray — no squeeze / idle.
4. Overbought / Oversold zones
Dashed horizontal lines at ±40 (default) and ±60 (extreme). When SMI enters these zones, background shading turns green/red to make it obvious.
5. Signals
Two tiers, so you can visually distinguish the strongest setups:
Small BUY / SELL triangles — regular SMI cross that passes all standard filters.
★ PWR ★ labels — the Power Signal. Regular signal PLUS squeeze alignment PLUS momentum direction agreement. These are the "everything is lined up" trades.
6. Divergences
Optional. Regular bull/bear divergences between price and SMI are marked with labels at the pivot bar.
7. Info table
Top-right corner (position adjustable). Live snapshot of every state variable that matters:
Overall bias (LONG / SHORT / Recovering / Fading)
SMI value, Signal value, HTF SMI value
Squeeze state (COILED / FIRED! / Fresh Fire / Released / Idle)
Momentum direction (Bull accel / Bear accel / Bull fade / Bear fade)
Trend state (UP / DOWN)
Volatility filter status (yes / no)
How to use it
The core workflow
Step 1 — Read the squeeze dot.
Row of black dots = market is coiled. Sit on your hands. Do not enter random signals in a squeeze.
Dot turns aqua = the squeeze just fired. A move is now much more likely.
Step 2 — Check the histogram color the moment the fire event happens.
Bright lime bars = the release is bullish.
Bright red bars = the release is bearish.
The color tells you which side to look for.
Step 3 — Wait for the SMI cross in that direction.
If the fire is bullish, look for SMI to cross above Signal (and ideally still be below the overbought zone).
If the fire is bearish, look for SMI to cross below Signal (and ideally still be above the oversold zone).
Step 4 — Take the ★ PWR ★ signal.
When all conditions are met, the label prints. This is the strongest setup the indicator produces.
Regular BUY/SELL triangles are also valid but lower conviction — treat them as "the direction is right but the market isn't necessarily ready to move yet."
Reading the info table for quick context
Glance at the table for a 5-second read of the market state:
Squeeze = COILED, Momentum = Bull accel → be patient, prepare to buy the fire.
Squeeze = FIRED!, Momentum = Bull accel, Trend = UP → primary long conditions.
Squeeze = Idle, Momentum = Bear fade → range environment, low conviction either way.
Squeeze = Released, Momentum = Bear accel → active downside move, don't fade it.
Divergences
Regular divergences are early warning of trend exhaustion. They are best combined with the squeeze/momentum picture:
Bear divergence + squeeze fires bearish = high-quality short reversal setup.
Bull divergence + squeeze fires bullish = high-quality long reversal setup.
Divergence alone during a squeeze (no fire yet) means nothing until the squeeze resolves.
Settings guide
SMI Calculation
%K Length (10): Lookback for the high/low range. Lower = faster, more signals. Higher = smoother.
%D Length (3), %DD Length (3): First and second smoothing periods. Blau's original is 3/3.
Signal Length (5): EMA of the SMI for cross signals.
Smoothing MA (EMA): SMA / EMA / WMA / RMA / HMA / TEMA / DEMA. TEMA reduces lag noticeably without adding much noise — good default for low timeframes.
Levels
Overbought / Oversold (±40): Signal-blocking zones. Default is more sensitive than a standard Stochastic (±80/20) because SMI's double smoothing spends more time in the middle.
Extreme (±60): Visual reference for aggressive OB/OS.
Squeeze Momentum
BB Length (20), BB StdDev (2.0): Bollinger Band settings.
KC Length (20), KC Range Mult (1.5): Keltner Channel settings. 1.5 = TTM standard (tighter, more fires). 2.0 = LazyBear default (looser, fewer but stronger fires).
Use TrueRange: LazyBear's original uses TR; TTM's original uses high-low. TR is more responsive.
Bars after fire = 'fresh' (10): How long after a squeeze fires the "fresh fire" flag stays active for Power Signal purposes.
Show / normalize histogram: Toggle and scale the histogram.
Signal Filters (built for low-timeframe noise)
Trend Filter (EMA200): Longs only above the trend EMA, shorts only below. Kills counter-trend signals.
HTF Confirmation (15m default): Signal only fires if the higher-timeframe SMI agrees on direction. Non-repainting — uses the previous closed HTF bar.
ATR Volatility Filter (0.75x): Requires current ATR to be at least 75% of its own 50-period SMA. Skips signals when volatility is too low to move price meaningfully.
Session Filter (07:00–16:00 default): Optional. Only signal during high-liquidity hours.
Confirmation Bars (1): Cross must hold for N consecutive bars before firing. Set to 2 or 3 on 1m for fewer false signals.
Divergence
Standard pivot-based lookback settings. Increase pivot lookback for stronger, less frequent divergences.
Visuals
Toggle histogram source, OB/OS shading, info table, table position.
Recommended presets
Gold / FX on 1-minute
SMI: 10 / 3 / 3 / 5, TEMA smoothing
Squeeze: BB 20/2.0, KC 20/1.5, TrueRange ON
HTF: 15m
Trend: EMA 200 ON
ATR: 0.75x ON
Confirm: 2 bars
Session: OFF (or 0700–1600 exchange time)
Stocks on 5-minute
SMI: 13 / 5 / 3 / 5, EMA
Squeeze: BB 20/2.0, KC 20/2.0 (looser)
HTF: 1H
Trend: EMA 200 ON
Confirm: 1 bar
Crypto on 15-minute
SMI: 14 / 3 / 3 / 5, EMA
Squeeze: BB 20/2.0, KC 20/1.5
HTF: 4H
Trend: EMA 200 ON
ATR: OFF (crypto is usually volatile enough)
Session: OFF
Higher-timeframe swing (4H / Daily)
SMI: 21 / 5 / 3 / 8, EMA
Squeeze: BB 20/2.0, KC 20/2.0
HTF: 1D or 1W
Trend: EMA 200 ON
Confirm: 1 bar
Divergence: ON, lookbacks 7/5
Alerts
The indicator ships with nine ready-to-use alertconditions:
★ POWER LONG — highest-conviction long setup
★ POWER SHORT — highest-conviction short setup
Squeeze Fired — the moment volatility releases (worth setting on its own — pings you before the move even develops direction)
SMI Long / Short (regular) — standard SMI cross with filters, without squeeze confirmation
SMI zero-line UP / DOWN — macro momentum shift
Bullish / Bearish divergence — early reversal warning
Right-click the indicator → Add alert → Condition → Momentum Ignition → pick the event.
What makes this different from a stock SMI + separate Squeeze indicator
Anyone can drop LazyBear's Squeeze and a standard SMI on their chart. What this indicator adds:
Merged Power Signal logic — you don't have to eyeball whether the two agree; the indicator only fires when they do.
Non-repainting HTF confirmation — proper barmerge.lookahead_off with [1] offset. The signals you see in replay are the signals you would have seen live.
Volatility gating — the ATR filter kills the low-vol whipsaw signals that plague both indicators on lower timeframes.
Trend gating — no counter-trend signals unless you explicitly disable the filter.
Streak-based confirmation — configurable N-bar hold requirement before signal fires.
Selectable smoothing types — most SMI implementations lock you into EMA. TEMA in particular is significantly better on 1m charts.
Squeeze normalization — the Squeeze Momentum histogram is scaled to the SMI's ±100 range so both fit cleanly in one pane; no separate indicator needed.
Info table — instant read of every state variable without hunting through plot values.
Limitations
Not a strategy. This is an indicator, not a backtestable strategy. Signals are not entry/exit rules — they are conditions for you to evaluate against your own trade plan.
HTF confirmation adds lag. By design, the HTF filter waits for the higher-timeframe bar to close. This delays signals in exchange for reliability. Turn it off if you want purely current-TF signals.
Squeeze fires do not guarantee direction. A fire event means volatility is expanding, not which way. The Power Signal requires the histogram color to confirm direction — trust that requirement.
Low-volatility instruments and dead sessions produce weak fires. Use the ATR filter or the session filter to skip these.
Divergence detection uses closed pivots. Divergences confirm divLbR bars after the pivot forms. This is unavoidable for any pivot-based divergence method.
Credits
This indicator combines and extends two pieces of open-source work. Please credit the originals:
Stochastic Momentum Index — William Blau, Technical Analysis of Stocks & Commodities, January 1993.
Squeeze Momentum Indicator — LazyBear (TradingView profile). The squeeze detection and momentum linear-regression logic are adapted from LazyBear's original Pine implementation, which itself is based on John Carter's TTM Squeeze from Mastering the Trade (McGraw-Hill, 2005).
All additional logic — the Power Signal merge, HTF confirmation, filter stack, non-repainting security calls, info table, normalization, and multi-MA smoothing — is original to this indicator.
Disclaimer
This indicator is provided for educational and analytical purposes only. It is not financial advice. Nothing displayed by this indicator constitutes a recommendation to buy or sell any security. All trading involves risk, including the risk of losing all capital. Past performance and hypothetical results do not guarantee future returns. Do your own research and consult a licensed financial advisor before making investment decisions.Overview
Momentum Ignition merges two of the most respected concepts in technical analysis — the Stochastic Momentum Index (SMI) by William Blau and the Squeeze Momentum Indicator by LazyBear (which is itself a Pine Script implementation of John Carter's TTM Squeeze). Neither indicator on its own answers the two questions a trader actually needs answered on every signal:
Which way is momentum turning? → SMI answers this.
Is the market actually about to move, or is this just noise inside a range? → Squeeze Momentum answers this.
Momentum Ignition combines them into a single-pane oscillator that produces a Power Signal only when both agree, and gives you a full read on the market state at a glance via a live info table.
The indicator is fully configurable, non-repainting on higher-timeframe confirmation, and includes multiple filters designed specifically to reduce false signals on low-timeframe charts (1m/3m/5m).
Why this pairing works
The Stochastic Momentum Index (Blau, 1993) is a double-smoothed refinement of the classic Stochastic. Instead of measuring where price sits within a range, it measures where price sits relative to the midpoint of that range, then double-smooths the result. This produces a cleaner, less-noisy oscillator that oscillates between -100 and +100 with much less whipsaw than the standard Stochastic.
The Squeeze Momentum Indicator (LazyBear's version of John Carter's TTM Squeeze) does something completely different — it detects volatility compression by checking whether the Bollinger Bands are contained inside the Keltner Channels. When they are, the market is coiled. When they expand back out, the squeeze "fires" — historically the beginning of the largest directional moves.
Neither indicator sees what the other sees. SMI can flash a beautiful cross in the middle of a dead range. The Squeeze can fire while momentum is still ambiguous. Combined, you get:
SMI = trade direction and momentum
Squeeze = permission to take the trade (or not)
The Power Signal requires both to align.
Components on the chart
1. SMI + Signal + HTF SMI (three lines)
Blue line — SMI on the current timeframe
Orange line — Signal (smoothed SMI)
Purple line — SMI computed on a user-selected higher timeframe (default 15-minute). Non-repainting.
2. Squeeze Momentum histogram (4-color)
Plotted as columns behind the SMI lines. Colors follow LazyBear's convention:
Bright lime — momentum positive AND rising (bull accelerating)
Dim green — momentum positive but falling (bull fading)
Bright red — momentum negative AND falling (bear accelerating)
Dim maroon — momentum negative but rising (bear fading)
The histogram is normalized to the ±100 SMI scale by default so it fits cleanly in the pane.
3. Squeeze state dot (on zero-line)
A small colored dot printed at zero on every bar. This is the key visual for reading market state:
Black — squeeze is ON (coiled). Wait, don't chase.
Aqua — squeeze just FIRED this bar. Move imminent.
Gray — squeeze is off (released).
Faint gray — no squeeze / idle.
4. Overbought / Oversold zones
Dashed horizontal lines at ±40 (default) and ±60 (extreme). When SMI enters these zones, background shading turns green/red to make it obvious.
5. Signals
Two tiers, so you can visually distinguish the strongest setups:
Small BUY / SELL triangles — regular SMI cross that passes all standard filters.
★ PWR ★ labels — the Power Signal. Regular signal PLUS squeeze alignment PLUS momentum direction agreement. These are the "everything is lined up" trades.
6. Divergences
Optional. Regular bull/bear divergences between price and SMI are marked with labels at the pivot bar.
7. Info table
Top-right corner (position adjustable). Live snapshot of every state variable that matters:
Overall bias (LONG / SHORT / Recovering / Fading)
SMI value, Signal value, HTF SMI value
Squeeze state (COILED / FIRED! / Fresh Fire / Released / Idle)
Momentum direction (Bull accel / Bear accel / Bull fade / Bear fade)
Trend state (UP / DOWN)
Volatility filter status (yes / no)
How to use it
The core workflow
Step 1 — Read the squeeze dot.
Row of black dots = market is coiled. Sit on your hands. Do not enter random signals in a squeeze.
Dot turns aqua = the squeeze just fired. A move is now much more likely.
Step 2 — Check the histogram color the moment the fire event happens.
Bright lime bars = the release is bullish.
Bright red bars = the release is bearish.
The color tells you which side to look for.
Step 3 — Wait for the SMI cross in that direction.
If the fire is bullish, look for SMI to cross above Signal (and ideally still be below the overbought zone).
If the fire is bearish, look for SMI to cross below Signal (and ideally still be above the oversold zone).
Step 4 — Take the ★ PWR ★ signal.
When all conditions are met, the label prints. This is the strongest setup the indicator produces.
Regular BUY/SELL triangles are also valid but lower conviction — treat them as "the direction is right but the market isn't necessarily ready to move yet."
Reading the info table for quick context
Glance at the table for a 5-second read of the market state:
Squeeze = COILED, Momentum = Bull accel → be patient, prepare to buy the fire.
Squeeze = FIRED!, Momentum = Bull accel, Trend = UP → primary long conditions.
Squeeze = Idle, Momentum = Bear fade → range environment, low conviction either way.
Squeeze = Released, Momentum = Bear accel → active downside move, don't fade it.
Divergences
Regular divergences are early warning of trend exhaustion. They are best combined with the squeeze/momentum picture:
Bear divergence + squeeze fires bearish = high-quality short reversal setup.
Bull divergence + squeeze fires bullish = high-quality long reversal setup.
Divergence alone during a squeeze (no fire yet) means nothing until the squeeze resolves.
Settings guide
SMI Calculation
%K Length (10): Lookback for the high/low range. Lower = faster, more signals. Higher = smoother.
%D Length (3), %DD Length (3): First and second smoothing periods. Blau's original is 3/3.
Signal Length (5): EMA of the SMI for cross signals.
Smoothing MA (EMA): SMA / EMA / WMA / RMA / HMA / TEMA / DEMA. TEMA reduces lag noticeably without adding much noise — good default for low timeframes.
Levels
Overbought / Oversold (±40): Signal-blocking zones. Default is more sensitive than a standard Stochastic (±80/20) because SMI's double smoothing spends more time in the middle.
Extreme (±60): Visual reference for aggressive OB/OS.
Squeeze Momentum
BB Length (20), BB StdDev (2.0): Bollinger Band settings.
KC Length (20), KC Range Mult (1.5): Keltner Channel settings. 1.5 = TTM standard (tighter, more fires). 2.0 = LazyBear default (looser, fewer but stronger fires).
Use TrueRange: LazyBear's original uses TR; TTM's original uses high-low. TR is more responsive.
Bars after fire = 'fresh' (10): How long after a squeeze fires the "fresh fire" flag stays active for Power Signal purposes.
Show / normalize histogram: Toggle and scale the histogram.
Signal Filters (built for low-timeframe noise)
Trend Filter (EMA200): Longs only above the trend EMA, shorts only below. Kills counter-trend signals.
HTF Confirmation (15m default): Signal only fires if the higher-timeframe SMI agrees on direction. Non-repainting — uses the previous closed HTF bar.
ATR Volatility Filter (0.75x): Requires current ATR to be at least 75% of its own 50-period SMA. Skips signals when volatility is too low to move price meaningfully.
Session Filter (07:00–16:00 default): Optional. Only signal during high-liquidity hours.
Confirmation Bars (1): Cross must hold for N consecutive bars before firing. Set to 2 or 3 on 1m for fewer false signals.
Divergence
Standard pivot-based lookback settings. Increase pivot lookback for stronger, less frequent divergences.
Visuals
Toggle histogram source, OB/OS shading, info table, table position.
Recommended presets
Gold / FX on 1-minute
SMI: 10 / 3 / 3 / 5, TEMA smoothing
Squeeze: BB 20/2.0, KC 20/1.5, TrueRange ON
HTF: 15m
Trend: EMA 200 ON
ATR: 0.75x ON
Confirm: 2 bars
Session: OFF (or 0700–1600 exchange time)
Stocks on 5-minute
SMI: 13 / 5 / 3 / 5, EMA
Squeeze: BB 20/2.0, KC 20/2.0 (looser)
HTF: 1H
Trend: EMA 200 ON
Confirm: 1 bar
Crypto on 15-minute
SMI: 14 / 3 / 3 / 5, EMA
Squeeze: BB 20/2.0, KC 20/1.5
HTF: 4H
Trend: EMA 200 ON
ATR: OFF (crypto is usually volatile enough)
Session: OFF
Higher-timeframe swing (4H / Daily)
SMI: 21 / 5 / 3 / 8, EMA
Squeeze: BB 20/2.0, KC 20/2.0
HTF: 1D or 1W
Trend: EMA 200 ON
Confirm: 1 bar
Divergence: ON, lookbacks 7/5
Alerts
The indicator ships with nine ready-to-use alertconditions:
★ POWER LONG — highest-conviction long setup
★ POWER SHORT — highest-conviction short setup
Squeeze Fired — the moment volatility releases (worth setting on its own — pings you before the move even develops direction)
SMI Long / Short (regular) — standard SMI cross with filters, without squeeze confirmation
SMI zero-line UP / DOWN — macro momentum shift
Bullish / Bearish divergence — early reversal warning
Right-click the indicator → Add alert → Condition → Momentum Ignition → pick the event.
What makes this different from a stock SMI + separate Squeeze indicator
Anyone can drop LazyBear's Squeeze and a standard SMI on their chart. What this indicator adds:
Merged Power Signal logic — you don't have to eyeball whether the two agree; the indicator only fires when they do.
Non-repainting HTF confirmation — proper barmerge.lookahead_off with [1] offset. The signals you see in replay are the signals you would have seen live.
Volatility gating — the ATR filter kills the low-vol whipsaw signals that plague both indicators on lower timeframes.
Trend gating — no counter-trend signals unless you explicitly disable the filter.
Streak-based confirmation — configurable N-bar hold requirement before signal fires.
Selectable smoothing types — most SMI implementations lock you into EMA. TEMA in particular is significantly better on 1m charts.
Squeeze normalization — the Squeeze Momentum histogram is scaled to the SMI's ±100 range so both fit cleanly in one pane; no separate indicator needed.
Info table — instant read of every state variable without hunting through plot values.
Limitations
Not a strategy. This is an indicator, not a backtestable strategy. Signals are not entry/exit rules — they are conditions for you to evaluate against your own trade plan.
HTF confirmation adds lag. By design, the HTF filter waits for the higher-timeframe bar to close. This delays signals in exchange for reliability. Turn it off if you want purely current-TF signals.
Squeeze fires do not guarantee direction. A fire event means volatility is expanding, not which way. The Power Signal requires the histogram color to confirm direction — trust that requirement.
Low-volatility instruments and dead sessions produce weak fires. Use the ATR filter or the session filter to skip these.
Divergence detection uses closed pivots. Divergences confirm divLbR bars after the pivot forms. This is unavoidable for any pivot-based divergence method.
Credits
This indicator combines and extends two pieces of open-source work. Please credit the originals:
Stochastic Momentum Index — William Blau, Technical Analysis of Stocks & Commodities, January 1993.
Squeeze Momentum Indicator — LazyBear (TradingView profile). The squeeze detection and momentum linear-regression logic are adapted from LazyBear's original Pine implementation, which itself is based on John Carter's TTM Squeeze from Mastering the Trade (McGraw-Hill, 2005).
All additional logic — the Power Signal merge, HTF confirmation, filter stack, non-repainting security calls, info table, normalization, and multi-MA smoothing — is original to this indicator.
Disclaimer
This indicator is provided for educational and analytical purposes only. It is not financial advice. Nothing displayed by this indicator constitutes a recommendation to buy or sell any security. All trading involves risk, including the risk of losing all capital. Past performance and hypothetical results do not guarantee future returns. Do your own research and consult a licensed financial advisor before making investment decisions.
Script open-source
Nello spirito di TradingView, l'autore di questo script lo ha reso open source, in modo che i trader possano esaminarne e verificarne la funzionalità. Complimenti all'autore! Sebbene sia possibile utilizzarlo gratuitamente, ricordiamo che la ripubblicazione del codice è soggetta al nostro Regolamento.

Declinazione di responsabilità
Le informazioni e le pubblicazioni non sono intese come, e non costituiscono, consulenza o raccomandazioni finanziarie, di investimento, di trading o di altro tipo fornite o approvate da TradingView. Per ulteriori informazioni, consultare i Termini di utilizzo.
Script open-source
Nello spirito di TradingView, l'autore di questo script lo ha reso open source, in modo che i trader possano esaminarne e verificarne la funzionalità. Complimenti all'autore! Sebbene sia possibile utilizzarlo gratuitamente, ricordiamo che la ripubblicazione del codice è soggetta al nostro Regolamento.
Declinazione di responsabilità
Le informazioni e le pubblicazioni non sono intese come, e non costituiscono, consulenza o raccomandazioni finanziarie, di investimento, di trading o di altro tipo fornite o approvate da TradingView. Per ulteriori informazioni, consultare i Termini di utilizzo.