OPEN-SOURCE SCRIPT
Aggiornato Global Tape World Markets 24h
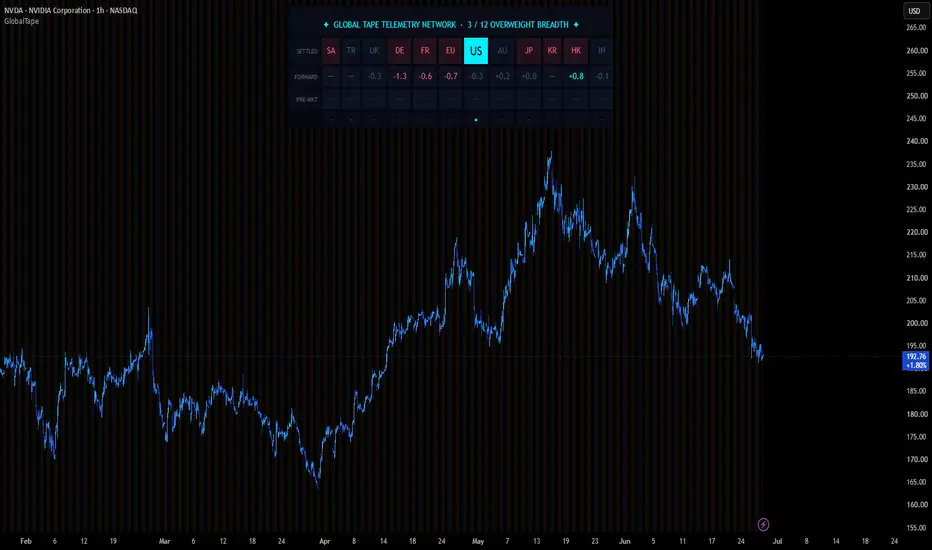
Global Tape — World Markets on the 24-Hour Clock
Global Tape arranges the world's stock markets as a single horizontal strip, ordered by the time each market opens. Read left to right, the strip is a 24-hour clock: markets on the left traded earlier in the day, markets on the right trade later, and the cell in the middle — shown in brackets — is the market that is open right now. Because the trading day is a loop, the strip rotates through the session so the live market stays in the centre, with the close of one day meeting the open of the next at the edges.
The strip is built for an intraday chart. It shows today's session as it unfolds, so it is designed to be read on a timeframe of 60 minutes or lower. On a daily or higher chart it displays a notice instead of values.
WHAT EACH MARKET SHOWS
Every market occupies one column with three rows.
SETTLED is how that market's most recent full trading day finished, shown as its change for the day and held until the market trades again. The colour shows direction and strength: green shades for a market that finished up, red shades for one that finished down, and a neutral slate for little change. A deeper colour means the move was broad across the market's main stocks; a faded cell means one stock did most of the moving, so the colour represents the whole market less well.
FORWARD is the index future for that market — a price that trades before and around the cash session. It shows where the future is trading now, ahead of the market's open. Where a market has no widely-traded retail future, the cell is left blank rather than filled with a substitute.
PRE-MKT stays empty for most markets most of the time. A mark appears only in the short window before a market opens, and it shows how far that market's future has moved since the window began. Trading is usually thin in this window, so a value here reflects movement during a period of lighter activity. Hovering the cell also shows how the move compares with that market's normal range, so an ordinary move and an unusually large one can be told apart.
Beneath the three rows is a registration track that marks the position of the live market, so the strip reads as a continuous film of the trading day.
HEADER
The header names the strip and gives a plain count of how many markets are higher on the day. It is a fact to notice, not a conclusion.
HOW THE COLORS ARE BUILT
The SETTLED color combines three things. Direction and strength come from how many of a market's tracked stocks moved up versus down. A market with only one tracked index can show direction but not breadth, so its color is held to the softer shades — a single index cannot represent agreement across a market. Vividness reflects how evenly the move was spread: when one stock dominates, the cell is shown more faded, as a reminder that the colour represents fewer names.
DATA AND SETUP
The strip reads each market through its own data feed, so it does not require extended-hours trading to be enabled on your chart. It does require that your TradingView data plan includes the markets shown — international indices and futures (for example Tokyo, Frankfurt, Hong Kong, and the index futures). A market your plan does not cover will appear blank.
Several symbols are exposed as inputs so they can be adjusted to match your data feed. Index futures vary by subscription, and the US leader stocks shown in the tooltip can be changed as market leadership changes over time. The pre-open window length and the colour thresholds are also adjustable.
NOTES
This is a descriptive instrument. It shows what each market has done and where its future is trading; it does not generate signals or suggest actions. The session times adjust automatically for daylight saving in each region.
Built on Pine Script v6.
Global Tape arranges the world's stock markets as a single horizontal strip, ordered by the time each market opens. Read left to right, the strip is a 24-hour clock: markets on the left traded earlier in the day, markets on the right trade later, and the cell in the middle — shown in brackets — is the market that is open right now. Because the trading day is a loop, the strip rotates through the session so the live market stays in the centre, with the close of one day meeting the open of the next at the edges.
The strip is built for an intraday chart. It shows today's session as it unfolds, so it is designed to be read on a timeframe of 60 minutes or lower. On a daily or higher chart it displays a notice instead of values.
WHAT EACH MARKET SHOWS
Every market occupies one column with three rows.
SETTLED is how that market's most recent full trading day finished, shown as its change for the day and held until the market trades again. The colour shows direction and strength: green shades for a market that finished up, red shades for one that finished down, and a neutral slate for little change. A deeper colour means the move was broad across the market's main stocks; a faded cell means one stock did most of the moving, so the colour represents the whole market less well.
FORWARD is the index future for that market — a price that trades before and around the cash session. It shows where the future is trading now, ahead of the market's open. Where a market has no widely-traded retail future, the cell is left blank rather than filled with a substitute.
PRE-MKT stays empty for most markets most of the time. A mark appears only in the short window before a market opens, and it shows how far that market's future has moved since the window began. Trading is usually thin in this window, so a value here reflects movement during a period of lighter activity. Hovering the cell also shows how the move compares with that market's normal range, so an ordinary move and an unusually large one can be told apart.
Beneath the three rows is a registration track that marks the position of the live market, so the strip reads as a continuous film of the trading day.
HEADER
The header names the strip and gives a plain count of how many markets are higher on the day. It is a fact to notice, not a conclusion.
HOW THE COLORS ARE BUILT
The SETTLED color combines three things. Direction and strength come from how many of a market's tracked stocks moved up versus down. A market with only one tracked index can show direction but not breadth, so its color is held to the softer shades — a single index cannot represent agreement across a market. Vividness reflects how evenly the move was spread: when one stock dominates, the cell is shown more faded, as a reminder that the colour represents fewer names.
DATA AND SETUP
The strip reads each market through its own data feed, so it does not require extended-hours trading to be enabled on your chart. It does require that your TradingView data plan includes the markets shown — international indices and futures (for example Tokyo, Frankfurt, Hong Kong, and the index futures). A market your plan does not cover will appear blank.
Several symbols are exposed as inputs so they can be adjusted to match your data feed. Index futures vary by subscription, and the US leader stocks shown in the tooltip can be changed as market leadership changes over time. The pre-open window length and the colour thresholds are also adjustable.
NOTES
This is a descriptive instrument. It shows what each market has done and where its future is trading; it does not generate signals or suggest actions. The session times adjust automatically for daylight saving in each region.
Built on Pine Script v6.
Note di rilascio
I have updated to the script to improve the information design aesthetic to help bridge the gap between data science, usability and graphic design. Updated description.
Granular Tooltip Intelligence Layer
To preserve a clean visual aesthetic while delivering deep analytical value, the HUD integrates a comprehensive data layer embedded directly within interactive cell tooltips. Hovering over the main header provides a structural summary of the global session flow and a strict reminder of its descriptive nature. When hovering over individual regional SETTLED chips, the tooltip expands into localized telemetry breakdowns —unveiling sub-asset specifics such as cash spot versus derivatives tracking for Japan , critical supply-chain vector stocks like Samsung and SK Hynix for South Korea , or a broader macro vector featuring the S&P 500, Nasdaq, and the VIX Volatility Index for the United States.
For the FORWARD and PRE-MKT rows, the tooltips explicitly identify the underlying liquid gateways and exchange networks handling the volume (e.g., CME, EUREX, OSE, ICE) . Inside an active pre-market pipeline, the tooltip delivers a precise mathematical status update: it calculates the exact percentage delta since the localized launch window initialized, tracks structural shifts in US tech bellwethers , and exposes a "Velocity Scale" that normalizes current directional momentum against the market's historical expected standard deviation. This multi-tiered tooltip design ensures that macro traders can immediately audit the underlying numbers driving global sentiment shifts without cluttering their active execution charts.
The Global Tape HUD is a 24-hour macro metric dashboard designed to visualize the international sequence of financial markets mapped relative to time. By transforming your chart into a global command center, this script organizes key international hubs into a sequential timeline that moves from East to West, allowing traders to monitor global risk conditions as they unfold across the globe.
The Power of "Following the Sun"
Markets do not operate in a vacuum. Price action and sentiment frequently ripple across time zones in a sequential chain reaction—often referred to as "following the sun." When a major macroeconomic catalyst or systematic sell-off begins during the Asian session (e.g., Tokyo or Hong Kong), the Global Tape allows you to visually track that momentum as it migrates west into the European morning, and finally how it primes the United States pre-market pipelines before the New York opening bell. Understanding this directional flow helps traders anticipate cross-market contagion rather than being blind-sided by it.
Core Analytical Use Cases
• Global Sentiment Contagion Tracking: Monitor systemic risk in real-time. If you notice deep crimson across the Asian and European columns, you can immediately gauge the probability of a gap-down or follow-through sell-off in the US session.
• Forward-Looking Expectation Gauging: Compare what has already occurred in the cash markets against what derivatives markets are currently pricing in for the upcoming sessions.
• Pre-Market Volatility Detection: Identify immediate velocity changes and sudden momentum shifts inside the critical launch windows right before local market opens.
HUD Architecture & Component Breakdown
The dashboard splits market telemetry into distinct, intuitive rows to give you a complete picture of global market structure at a glance:
• SETTLED Row: Displays the daily closing baseline vectors for localized spot indices. This anchors your bias to historical session states.
• FORWARD Row: Evaluates live-updating index derivatives and futures feeds (such as E-minis, Nikkei Futures, and DAX Futures) to index active real-time expectations.
• PRE-MKT Row: Captures exact momentum and volatility scaling inside the immediate localized market launch envelope. It calculates the delta since the pre-market window initialized alongside localized historical standard deviation metrics.
• CHRONO REGISTRATION: A dynamic tracking row that automatically centers and highlights the active "Gate"—identifying which global timezone currently dictates the primary volume focus.
TradingView House Rules Compliance & Disclaimer
Important Notice: This indicator is built exclusively for descriptive analytics and macro situational awareness. It does not provide buy/sell signals, algorithmic execution guidance, or definitive directional trade recommendations. Past global session momentum is not a guarantee of future session performance. Always utilize robust risk management frameworks.
Script open-source
Nello spirito di TradingView, l'autore di questo script lo ha reso open source, in modo che i trader possano esaminarne e verificarne la funzionalità. Complimenti all'autore! Sebbene sia possibile utilizzarlo gratuitamente, ricordiamo che la ripubblicazione del codice è soggetta al nostro Regolamento.

Declinazione di responsabilità
Le informazioni e le pubblicazioni non sono intese come, e non costituiscono, consulenza o raccomandazioni finanziarie, di investimento, di trading o di altro tipo fornite o approvate da TradingView. Per ulteriori informazioni, consultare i Termini di utilizzo.
Script open-source
Nello spirito di TradingView, l'autore di questo script lo ha reso open source, in modo che i trader possano esaminarne e verificarne la funzionalità. Complimenti all'autore! Sebbene sia possibile utilizzarlo gratuitamente, ricordiamo che la ripubblicazione del codice è soggetta al nostro Regolamento.
Declinazione di responsabilità
Le informazioni e le pubblicazioni non sono intese come, e non costituiscono, consulenza o raccomandazioni finanziarie, di investimento, di trading o di altro tipo fornite o approvate da TradingView. Per ulteriori informazioni, consultare i Termini di utilizzo.