[DAOL] Trend Participation
⏺️ What is it?
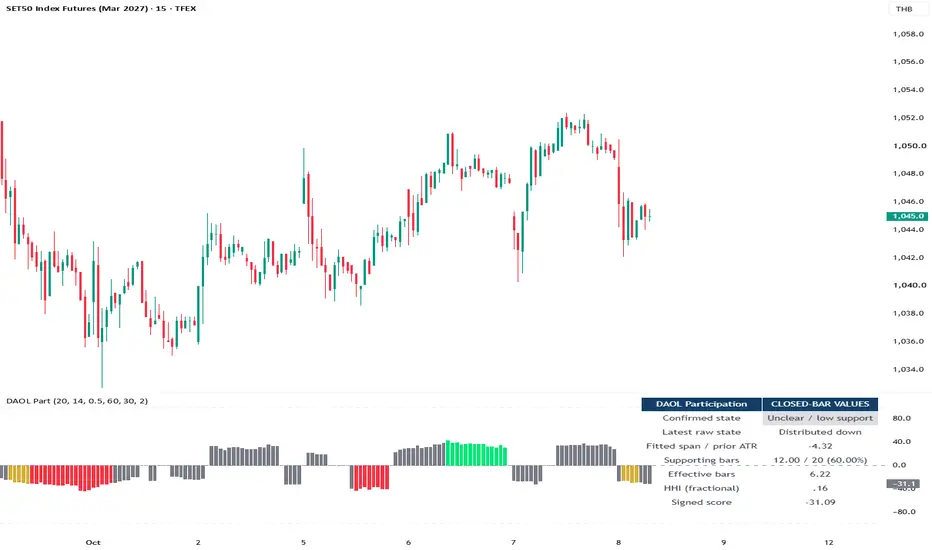
[DAOL] Trend Participation examines how price movement is distributed across bars within a rolling window.
It combines linear-regression direction, the proportion of supporting close changes, and concentration measurement to distinguish distributed movement from movement dominated by a few large bars.
🔹 Trend Direction — linear-regression slope, filtered using ATR
🔹 Supporting Bars — close changes moving in the identified direction
🔹 Concentration — how unevenly directional movement is distributed
🔹 Effective Bars — the equivalent number of equally contributing bars
“Participation” refers to price bars. It does not measure trader counts, institutional activity, volume, or market breadth.
⏺️ Indicator นี้คืออะไร?
[DAOL] Trend Participation วิเคราะห์ว่า การเดินหน้าของราคาเกิดจากหลายแท่งร่วมกัน หรือกระจุกอยู่ในแท่งใหญ่ไม่กี่แท่ง
ผสมทิศทางจาก Linear Regression สัดส่วนแท่งที่เคลื่อนไหวตามทิศทาง และการวัดความกระจุกตัวของระยะเคลื่อนไหว
🔹 Trend Direction — ทิศทางจากความชัน Linear Regression โดยใช้ ATR กรองขนาด
🔹 Supporting Bars — การเปลี่ยนราคาปิดที่ไปตามทิศทาง
🔹 Concentration — ความกระจุกตัวของระยะเคลื่อนไหวตามทิศทาง
🔹 Effective Bars — จำนวนแท่งเทียบเท่าเมื่อแต่ละแท่งมีส่วนร่วมเท่ากัน
คำว่า Participation หมายถึง การมีส่วนร่วมของแท่งราคา ไม่ใช่จำนวนผู้ซื้อขาย เงินสถาบัน Volume หรือ Market Breadth
⏺️ Why use it?
🔹 Adds context to trends with similar net price changes
🔹 Distinguishes frequent directional movement from concentrated price jumps
🔹 Considers both supporting-bar count and contribution size
🔹 Normalizes the fitted trend span using prior-bar ATR
🔹 Provides closed-bar states and configurable confirmation
Many small supporting changes can coexist with one dominant move. Counting supporting bars alone would miss this distinction.
⏺️ ทำไมต้องใช้?
🔹 เพิ่มบริบทให้แนวโน้มที่มีการเปลี่ยนราคาสุทธิใกล้เคียงกัน
🔹 แยกการเดินหน้าหลายแท่งออกจากการกระโดดของราคาไม่กี่แท่ง
🔹 พิจารณาทั้งจำนวนแท่งที่สนับสนุนและขนาดการเคลื่อนไหว
🔹 เทียบขนาดแนวโน้มกับ ATR ของแท่งก่อนหน้า
🔹 มีสถานะจากแท่งปิดและกำหนดจำนวนแท่งยืนยันได้
แม้มีแท่งสนับสนุนหลายแท่ง ระยะส่วนใหญ่อาจมาจากแท่งใหญ่เพียงแท่งเดียว การนับจำนวนแท่งอย่างเดียวจึงอาจไม่เห็นความแตกต่างนี้
⏺️ How does it work?
Use 21 closing prices to evaluate 20 close-to-close changes by default.
Fit a linear regression to those same closing prices.
Multiply its slope by 20 and divide by prior-bar ATR.
Identify an upward or downward direction when the normalized fitted span meets the selected threshold.
Count close changes supporting that direction.
Measure concentration using the sizes of those supporting changes.
Confirm a state after consecutive closed bars.
A directionless window receives a score of zero. Insufficient data or unusable ATR produces unavailable values.
⏺️ ทำงานอย่างไร?
ใช้ราคาปิด 21 แท่งเพื่อวิเคราะห์การเปลี่ยนแปลง 20 ช่วงตามค่าเริ่มต้น
คำนวณ Linear Regression จากราคาปิดชุดเดียวกัน
นำความชันคูณ 20 แล้วหารด้วย ATR ของแท่งก่อนหน้า
ระบุทิศทางขึ้นหรือลงเมื่อขนาดที่ปรับด้วย ATR ผ่านเกณฑ์
นับการเปลี่ยนราคาปิดที่สนับสนุนทิศทางนั้น
วัดความกระจุกตัวจากขนาดการเปลี่ยนราคาที่สนับสนุน
รอสถานะเดิมต่อเนื่องตามจำนวนแท่งปิดที่เลือกก่อนยืนยัน
หากทิศทางไม่ผ่านเกณฑ์ คะแนนจะเป็นศูนย์ หากข้อมูลไม่ครบหรือ ATR ใช้งานไม่ได้ ค่าจะยังไม่พร้อมแสดง
⏺️ Concentration and effective bars
Each supporting price change receives a weight equal to its share of total supporting movement.
HHI = Sum of squared weights
Effective Bars = 1 / HHI
Examples:
🔹 10 equally sized supporting changes → 10 effective bars
🔹 One supporting change accounts for all directional movement → 1 effective bar
🔹 Many supporting changes with one dominant contribution → fewer effective bars than the supporting-bar count
Opposite-direction changes affect regression and supporting-bar percentage, but do not enter the concentration weights.
⏺️ ความกระจุกตัวและ Effective Bars
แต่ละการเปลี่ยนราคาที่ไปตามทิศทางได้รับน้ำหนักตามสัดส่วนของระยะที่สนับสนุนทั้งหมด
HHI = ผลรวมกำลังสองของน้ำหนัก
Effective Bars = 1 / HHI
ตัวอย่าง:
🔹 มี 10 การเปลี่ยนราคาที่สนับสนุนและขนาดเท่ากัน → Effective Bars เท่ากับ 10
🔹 ระยะตามทิศทางทั้งหมดมาจากการเปลี่ยนราคาเพียงครั้งเดียว → Effective Bars เท่ากับ 1
🔹 มีหลายแท่งสนับสนุน แต่แท่งหนึ่งมีขนาดโดดเด่น → Effective Bars ต่ำกว่าจำนวนแท่งสนับสนุนจริง
การเปลี่ยนราคาสวนทิศทางมีผลต่อความชันและสัดส่วนแท่งสนับสนุน แต่ไม่นำมาเป็นน้ำหนักของ HHI
แท่งที่ราคาปิดไม่เปลี่ยนยังนับในจำนวนช่วงทั้งหมด แต่ไม่นับเป็นแท่งสนับสนุน
⏺️ How to read the score
Score = Direction × 100 × Effective Bars / Window Length
The score ranges from −100 to +100.
🔹 Positive — upward regression direction
🔹 Negative — downward regression direction
🔹 Larger absolute value — more effective supporting bars relative to the window
For a 20-change window, 8 effective supporting bars produce a magnitude of 40.
The score is not a win probability, expected return, or direct measure of trend strength. Color classification also considers direction and supporting-bar percentage.
⏺️ อ่านคะแนนอย่างไร?
Score = ทิศทาง × 100 × Effective Bars / จำนวนช่วงที่วิเคราะห์
คะแนนอยู่ระหว่าง −100 ถึง +100
🔹 บวก — ทิศทางจาก Regression เป็นขาขึ้น
🔹 ลบ — ทิศทางจาก Regression เป็นขาลง
🔹 ขนาดคะแนนมาก — มีแท่งสนับสนุนเชิงประสิทธิผลมากเมื่อเทียบกับช่วงทั้งหมด
หากวิเคราะห์ 20 ช่วงและมี Effective Bars เท่ากับ 8 ขนาดคะแนนจะเท่ากับ 40
คะแนนไม่ใช่โอกาสชนะ ผลตอบแทนคาดหวัง หรือค่าความแข็งแรงของเทรนด์โดยตรง สีของสถานะยังพิจารณาทิศทางและสัดส่วนแท่งสนับสนุนด้วย
⏺️ How to read the colors
🔹 Green — upward direction with sufficient support and distributed contributions
🔹 Red — downward direction with sufficient support and distributed contributions
🔹 Gold — sufficient supporting-bar count, but movement is concentrated
🔹 Gray — unclear direction, insufficient support, or state confirmation pending
Default requirements:
🔹 Absolute fitted span / prior ATR ≥ 0.5
🔹 Supporting bars ≥ 60% of the window
🔹 Effective bars ≥ 30% of the window for a distributed state
Gold identifies concentration. It does not confirm exhaustion or an approaching reversal.
⏺️ อ่านสีอย่างไร?
🔹 เขียว — ทิศทางขึ้น มีแท่งสนับสนุนเพียงพอและระยะกระจายตัว
🔹 แดง — ทิศทางลง มีแท่งสนับสนุนเพียงพอและระยะกระจายตัว
🔹 ทอง — จำนวนแท่งสนับสนุนผ่านเกณฑ์ แต่ระยะกระจุกตัว
🔹 เทา — ทิศทางไม่ชัด แท่งสนับสนุนไม่เพียงพอ หรือยังรอยืนยันสถานะแรก
เกณฑ์ตามค่าเริ่มต้น:
🔹 ขนาด Fitted Span / ATR ของแท่งก่อนหน้า ≥ 0.5
🔹 แท่งสนับสนุน ≥ 60% ของช่วงทั้งหมด
🔹 Effective Bars ≥ 30% ของช่วงทั้งหมด จึงจัดเป็นสถานะกระจายตัว
สีทองไม่ได้ยืนยันว่าเทรนด์หมดแรงหรือกำลังกลับตัว
⏺️ Dashboard and confirmation
The dashboard displays:
🔹 Confirmed state
🔹 Latest raw state
🔹 Signed fitted span / prior ATR
🔹 Supporting-bar count and percentage
🔹 Effective Bars
🔹 HHI using fractional weights
🔹 Signed score
Metrics update on each closed bar. State colors require confirmation and may temporarily retain the preceding state while a new candidate develops.
⏺️ Dashboard และการยืนยัน
Dashboard แสดง:
🔹 สถานะที่ยืนยันแล้ว
🔹 สถานะล่าสุดก่อนยืนยัน
🔹 Fitted Span / ATR พร้อมเครื่องหมายทิศทาง
🔹 จำนวนและเปอร์เซ็นต์แท่งสนับสนุน
🔹 Effective Bars
🔹 HHI ที่คำนวณจากน้ำหนักสัดส่วน 0–1
🔹 คะแนนพร้อมเครื่องหมายทิศทาง
ค่าตัวเลขอัปเดตทุกแท่งปิด ส่วนสีรอการยืนยัน จึงอาจยังแสดงสถานะเดิมระหว่างที่สถานะใหม่กำลังก่อตัว
⏺️ Default settings
🔹 Window — 20 close changes
🔹 ATR Length — 14
🔹 Minimum Fitted Span / Prior ATR — 0.5
🔹 Minimum Supporting Bars — 60%
🔹 Minimum Effective Bars / Window — 30%
🔹 Confirmation — 2 consecutive closed bars
Use standard OHLC or candlestick charts. The calculation uses a rolling window and does not reset at each session.
⏺️ ค่าเริ่มต้น
🔹 Window — 20 การเปลี่ยนแปลงของราคาปิด
🔹 ATR Length — 14
🔹 Minimum Fitted Span / Prior ATR — 0.5
🔹 Minimum Supporting Bars — 60%
🔹 Minimum Effective Bars / Window — 30%
🔹 Confirmation — 2 แท่งปิดต่อเนื่อง
ใช้กราฟ OHLC หรือแท่งเทียนมาตรฐาน สูตรเป็นหน้าต่างเลื่อนตามแท่งล่าสุดและไม่รีเซ็ตเมื่อเริ่ม Session ใหม่
⏺️ Alerts
🔹 Distributed up
🔹 Distributed down
🔹 Concentrated movement
🔹 Unclear or low support
🔹 Any confirmed state change
The initial confirmed state initializes silently. Subsequent confirmed transitions trigger alerts.
Select “Once Per Bar Close” and recreate alerts after changing inputs or code.
⏺️ การแจ้งเตือน
🔹 Distributed up — ขาขึ้นที่ระยะกระจายตัว
🔹 Distributed down — ขาลงที่ระยะกระจายตัว
🔹 Concentrated movement — การเคลื่อนที่กระจุกตัว
🔹 Unclear or low support — ทิศทางไม่ชัดหรือแท่งสนับสนุนต่ำ
🔹 Any confirmed state change — ทุกการเปลี่ยนสถานะที่ยืนยันแล้ว
สถานะแรกใช้เริ่มต้นระบบโดยไม่แจ้งเตือน จากนั้นแจ้งเมื่อสถานะยืนยันเปลี่ยน
ตั้ง “Once Per Bar Close” และสร้าง Alert ใหม่หลังเปลี่ยน Input หรือโค้ด
⏺️ Development and references
This Pine Script v6 implementation combines linear regression, ATR normalization and a concentration measure adapted from the Herfindahl–Hirschman Index.
The extension applies concentration analysis to supporting close changes and converts it into an effective number of contributing bars.
No Community script code was copied for this implementation. These underlying mathematical concepts are established methods; no claim is made that they are new.
References:
🔹 TradingView — Least Squares Moving Average
tradingview.com/support/solutions/43000599877-least-squares-moving-average/
🔹 U.S. Department of Justice — Herfindahl–Hirschman Index
justice.gov/atr/herfindahl-hirschman-index
⏺️ การพัฒนาและอ้างอิง
เขียนด้วย Pine Script v6 โดยผสม Linear Regression การปรับขนาดด้วย ATR และแนวคิดความกระจุกตัวจาก Herfindahl–Hirschman Index
ส่วนที่ต่อยอดคือการใช้ความกระจุกตัวกับการเปลี่ยนราคาปิดที่สนับสนุนทิศทาง แล้วแปลงเป็นจำนวนแท่งที่มีส่วนร่วมเชิงประสิทธิผล
ไม่คัดลอกโค้ดจากสคริปต์ Community สำหรับการพัฒนาครั้งนี้ หลักการคณิตศาสตร์พื้นฐานมีอยู่แล้ว ไม่ได้อ้างว่าเป็นสิ่งประดิษฐ์ใหม่ทั้งหมด และไม่ได้ใช้เกณฑ์การแข่งขันทางการค้าของ HHI มาตัดสินตลาดการเงิน
⏺️ Limitations and disclaimer
🔹 Distributed movement does not guarantee trend continuation.
🔹 Concentrated movement can occur during a valid repricing event.
🔹 Closing-price changes exclude intrabar price paths.
🔹 Sparse trading, session gaps and continuous-futures rolls can distort interpretation.
🔹 Changes can occur as old observations leave the rolling window.
🔹 Closed-bar confirmation delays state changes and does not prevent data revisions.
🔹 Numerical checks have been completed; TradingView compilation and market-data validation remain pending.
🔹 For educational and informational purposes only. No investment advice or return guarantee is provided.
⏺️ ข้อจำกัดและคำชี้แจง
🔹 การกระจายตัวไม่ได้รับประกันว่าแนวโน้มจะเดินหน้าต่อ
🔹 การกระจุกตัวอาจเกิดจากการปรับระดับราคาที่มีเหตุผลรองรับ
🔹 การเปลี่ยนราคาปิดไม่สะท้อนเส้นทางราคาทั้งหมดภายในแท่ง
🔹 การซื้อขายเบาบาง Gap ระหว่าง Session และรอยต่อสัญญา Futures อาจทำให้ตีความคลาดเคลื่อน
🔹 ค่าสามารถเปลี่ยนเมื่อข้อมูลเก่าออกจากหน้าต่างคำนวณ
🔹 การรอแท่งปิดทำให้สถานะยืนยันช้าลง และไม่ป้องกันการแก้ไขข้อมูลย้อนหลัง
🔹 ตรวจสูตรเชิงตัวเลขแล้ว แต่ยังไม่ได้ compile ใน TradingView หรือทดสอบข้อมูลตลาดจริง
🔹 ใช้เพื่อการศึกษาและประกอบการวิเคราะห์ ไม่ใช่คำแนะนำการลงทุนหรือการรับประกันผลตอบแทน
[DAOL] Trend Participation examines how price movement is distributed across bars within a rolling window.
It combines linear-regression direction, the proportion of supporting close changes, and concentration measurement to distinguish distributed movement from movement dominated by a few large bars.
🔹 Trend Direction — linear-regression slope, filtered using ATR
🔹 Supporting Bars — close changes moving in the identified direction
🔹 Concentration — how unevenly directional movement is distributed
🔹 Effective Bars — the equivalent number of equally contributing bars
“Participation” refers to price bars. It does not measure trader counts, institutional activity, volume, or market breadth.
⏺️ Indicator นี้คืออะไร?
[DAOL] Trend Participation วิเคราะห์ว่า การเดินหน้าของราคาเกิดจากหลายแท่งร่วมกัน หรือกระจุกอยู่ในแท่งใหญ่ไม่กี่แท่ง
ผสมทิศทางจาก Linear Regression สัดส่วนแท่งที่เคลื่อนไหวตามทิศทาง และการวัดความกระจุกตัวของระยะเคลื่อนไหว
🔹 Trend Direction — ทิศทางจากความชัน Linear Regression โดยใช้ ATR กรองขนาด
🔹 Supporting Bars — การเปลี่ยนราคาปิดที่ไปตามทิศทาง
🔹 Concentration — ความกระจุกตัวของระยะเคลื่อนไหวตามทิศทาง
🔹 Effective Bars — จำนวนแท่งเทียบเท่าเมื่อแต่ละแท่งมีส่วนร่วมเท่ากัน
คำว่า Participation หมายถึง การมีส่วนร่วมของแท่งราคา ไม่ใช่จำนวนผู้ซื้อขาย เงินสถาบัน Volume หรือ Market Breadth
⏺️ Why use it?
🔹 Adds context to trends with similar net price changes
🔹 Distinguishes frequent directional movement from concentrated price jumps
🔹 Considers both supporting-bar count and contribution size
🔹 Normalizes the fitted trend span using prior-bar ATR
🔹 Provides closed-bar states and configurable confirmation
Many small supporting changes can coexist with one dominant move. Counting supporting bars alone would miss this distinction.
⏺️ ทำไมต้องใช้?
🔹 เพิ่มบริบทให้แนวโน้มที่มีการเปลี่ยนราคาสุทธิใกล้เคียงกัน
🔹 แยกการเดินหน้าหลายแท่งออกจากการกระโดดของราคาไม่กี่แท่ง
🔹 พิจารณาทั้งจำนวนแท่งที่สนับสนุนและขนาดการเคลื่อนไหว
🔹 เทียบขนาดแนวโน้มกับ ATR ของแท่งก่อนหน้า
🔹 มีสถานะจากแท่งปิดและกำหนดจำนวนแท่งยืนยันได้
แม้มีแท่งสนับสนุนหลายแท่ง ระยะส่วนใหญ่อาจมาจากแท่งใหญ่เพียงแท่งเดียว การนับจำนวนแท่งอย่างเดียวจึงอาจไม่เห็นความแตกต่างนี้
⏺️ How does it work?
Use 21 closing prices to evaluate 20 close-to-close changes by default.
Fit a linear regression to those same closing prices.
Multiply its slope by 20 and divide by prior-bar ATR.
Identify an upward or downward direction when the normalized fitted span meets the selected threshold.
Count close changes supporting that direction.
Measure concentration using the sizes of those supporting changes.
Confirm a state after consecutive closed bars.
A directionless window receives a score of zero. Insufficient data or unusable ATR produces unavailable values.
⏺️ ทำงานอย่างไร?
ใช้ราคาปิด 21 แท่งเพื่อวิเคราะห์การเปลี่ยนแปลง 20 ช่วงตามค่าเริ่มต้น
คำนวณ Linear Regression จากราคาปิดชุดเดียวกัน
นำความชันคูณ 20 แล้วหารด้วย ATR ของแท่งก่อนหน้า
ระบุทิศทางขึ้นหรือลงเมื่อขนาดที่ปรับด้วย ATR ผ่านเกณฑ์
นับการเปลี่ยนราคาปิดที่สนับสนุนทิศทางนั้น
วัดความกระจุกตัวจากขนาดการเปลี่ยนราคาที่สนับสนุน
รอสถานะเดิมต่อเนื่องตามจำนวนแท่งปิดที่เลือกก่อนยืนยัน
หากทิศทางไม่ผ่านเกณฑ์ คะแนนจะเป็นศูนย์ หากข้อมูลไม่ครบหรือ ATR ใช้งานไม่ได้ ค่าจะยังไม่พร้อมแสดง
⏺️ Concentration and effective bars
Each supporting price change receives a weight equal to its share of total supporting movement.
HHI = Sum of squared weights
Effective Bars = 1 / HHI
Examples:
🔹 10 equally sized supporting changes → 10 effective bars
🔹 One supporting change accounts for all directional movement → 1 effective bar
🔹 Many supporting changes with one dominant contribution → fewer effective bars than the supporting-bar count
Opposite-direction changes affect regression and supporting-bar percentage, but do not enter the concentration weights.
⏺️ ความกระจุกตัวและ Effective Bars
แต่ละการเปลี่ยนราคาที่ไปตามทิศทางได้รับน้ำหนักตามสัดส่วนของระยะที่สนับสนุนทั้งหมด
HHI = ผลรวมกำลังสองของน้ำหนัก
Effective Bars = 1 / HHI
ตัวอย่าง:
🔹 มี 10 การเปลี่ยนราคาที่สนับสนุนและขนาดเท่ากัน → Effective Bars เท่ากับ 10
🔹 ระยะตามทิศทางทั้งหมดมาจากการเปลี่ยนราคาเพียงครั้งเดียว → Effective Bars เท่ากับ 1
🔹 มีหลายแท่งสนับสนุน แต่แท่งหนึ่งมีขนาดโดดเด่น → Effective Bars ต่ำกว่าจำนวนแท่งสนับสนุนจริง
การเปลี่ยนราคาสวนทิศทางมีผลต่อความชันและสัดส่วนแท่งสนับสนุน แต่ไม่นำมาเป็นน้ำหนักของ HHI
แท่งที่ราคาปิดไม่เปลี่ยนยังนับในจำนวนช่วงทั้งหมด แต่ไม่นับเป็นแท่งสนับสนุน
⏺️ How to read the score
Score = Direction × 100 × Effective Bars / Window Length
The score ranges from −100 to +100.
🔹 Positive — upward regression direction
🔹 Negative — downward regression direction
🔹 Larger absolute value — more effective supporting bars relative to the window
For a 20-change window, 8 effective supporting bars produce a magnitude of 40.
The score is not a win probability, expected return, or direct measure of trend strength. Color classification also considers direction and supporting-bar percentage.
⏺️ อ่านคะแนนอย่างไร?
Score = ทิศทาง × 100 × Effective Bars / จำนวนช่วงที่วิเคราะห์
คะแนนอยู่ระหว่าง −100 ถึง +100
🔹 บวก — ทิศทางจาก Regression เป็นขาขึ้น
🔹 ลบ — ทิศทางจาก Regression เป็นขาลง
🔹 ขนาดคะแนนมาก — มีแท่งสนับสนุนเชิงประสิทธิผลมากเมื่อเทียบกับช่วงทั้งหมด
หากวิเคราะห์ 20 ช่วงและมี Effective Bars เท่ากับ 8 ขนาดคะแนนจะเท่ากับ 40
คะแนนไม่ใช่โอกาสชนะ ผลตอบแทนคาดหวัง หรือค่าความแข็งแรงของเทรนด์โดยตรง สีของสถานะยังพิจารณาทิศทางและสัดส่วนแท่งสนับสนุนด้วย
⏺️ How to read the colors
🔹 Green — upward direction with sufficient support and distributed contributions
🔹 Red — downward direction with sufficient support and distributed contributions
🔹 Gold — sufficient supporting-bar count, but movement is concentrated
🔹 Gray — unclear direction, insufficient support, or state confirmation pending
Default requirements:
🔹 Absolute fitted span / prior ATR ≥ 0.5
🔹 Supporting bars ≥ 60% of the window
🔹 Effective bars ≥ 30% of the window for a distributed state
Gold identifies concentration. It does not confirm exhaustion or an approaching reversal.
⏺️ อ่านสีอย่างไร?
🔹 เขียว — ทิศทางขึ้น มีแท่งสนับสนุนเพียงพอและระยะกระจายตัว
🔹 แดง — ทิศทางลง มีแท่งสนับสนุนเพียงพอและระยะกระจายตัว
🔹 ทอง — จำนวนแท่งสนับสนุนผ่านเกณฑ์ แต่ระยะกระจุกตัว
🔹 เทา — ทิศทางไม่ชัด แท่งสนับสนุนไม่เพียงพอ หรือยังรอยืนยันสถานะแรก
เกณฑ์ตามค่าเริ่มต้น:
🔹 ขนาด Fitted Span / ATR ของแท่งก่อนหน้า ≥ 0.5
🔹 แท่งสนับสนุน ≥ 60% ของช่วงทั้งหมด
🔹 Effective Bars ≥ 30% ของช่วงทั้งหมด จึงจัดเป็นสถานะกระจายตัว
สีทองไม่ได้ยืนยันว่าเทรนด์หมดแรงหรือกำลังกลับตัว
⏺️ Dashboard and confirmation
The dashboard displays:
🔹 Confirmed state
🔹 Latest raw state
🔹 Signed fitted span / prior ATR
🔹 Supporting-bar count and percentage
🔹 Effective Bars
🔹 HHI using fractional weights
🔹 Signed score
Metrics update on each closed bar. State colors require confirmation and may temporarily retain the preceding state while a new candidate develops.
⏺️ Dashboard และการยืนยัน
Dashboard แสดง:
🔹 สถานะที่ยืนยันแล้ว
🔹 สถานะล่าสุดก่อนยืนยัน
🔹 Fitted Span / ATR พร้อมเครื่องหมายทิศทาง
🔹 จำนวนและเปอร์เซ็นต์แท่งสนับสนุน
🔹 Effective Bars
🔹 HHI ที่คำนวณจากน้ำหนักสัดส่วน 0–1
🔹 คะแนนพร้อมเครื่องหมายทิศทาง
ค่าตัวเลขอัปเดตทุกแท่งปิด ส่วนสีรอการยืนยัน จึงอาจยังแสดงสถานะเดิมระหว่างที่สถานะใหม่กำลังก่อตัว
⏺️ Default settings
🔹 Window — 20 close changes
🔹 ATR Length — 14
🔹 Minimum Fitted Span / Prior ATR — 0.5
🔹 Minimum Supporting Bars — 60%
🔹 Minimum Effective Bars / Window — 30%
🔹 Confirmation — 2 consecutive closed bars
Use standard OHLC or candlestick charts. The calculation uses a rolling window and does not reset at each session.
⏺️ ค่าเริ่มต้น
🔹 Window — 20 การเปลี่ยนแปลงของราคาปิด
🔹 ATR Length — 14
🔹 Minimum Fitted Span / Prior ATR — 0.5
🔹 Minimum Supporting Bars — 60%
🔹 Minimum Effective Bars / Window — 30%
🔹 Confirmation — 2 แท่งปิดต่อเนื่อง
ใช้กราฟ OHLC หรือแท่งเทียนมาตรฐาน สูตรเป็นหน้าต่างเลื่อนตามแท่งล่าสุดและไม่รีเซ็ตเมื่อเริ่ม Session ใหม่
⏺️ Alerts
🔹 Distributed up
🔹 Distributed down
🔹 Concentrated movement
🔹 Unclear or low support
🔹 Any confirmed state change
The initial confirmed state initializes silently. Subsequent confirmed transitions trigger alerts.
Select “Once Per Bar Close” and recreate alerts after changing inputs or code.
⏺️ การแจ้งเตือน
🔹 Distributed up — ขาขึ้นที่ระยะกระจายตัว
🔹 Distributed down — ขาลงที่ระยะกระจายตัว
🔹 Concentrated movement — การเคลื่อนที่กระจุกตัว
🔹 Unclear or low support — ทิศทางไม่ชัดหรือแท่งสนับสนุนต่ำ
🔹 Any confirmed state change — ทุกการเปลี่ยนสถานะที่ยืนยันแล้ว
สถานะแรกใช้เริ่มต้นระบบโดยไม่แจ้งเตือน จากนั้นแจ้งเมื่อสถานะยืนยันเปลี่ยน
ตั้ง “Once Per Bar Close” และสร้าง Alert ใหม่หลังเปลี่ยน Input หรือโค้ด
⏺️ Development and references
This Pine Script v6 implementation combines linear regression, ATR normalization and a concentration measure adapted from the Herfindahl–Hirschman Index.
The extension applies concentration analysis to supporting close changes and converts it into an effective number of contributing bars.
No Community script code was copied for this implementation. These underlying mathematical concepts are established methods; no claim is made that they are new.
References:
🔹 TradingView — Least Squares Moving Average
tradingview.com/support/solutions/43000599877-least-squares-moving-average/
🔹 U.S. Department of Justice — Herfindahl–Hirschman Index
justice.gov/atr/herfindahl-hirschman-index
⏺️ การพัฒนาและอ้างอิง
เขียนด้วย Pine Script v6 โดยผสม Linear Regression การปรับขนาดด้วย ATR และแนวคิดความกระจุกตัวจาก Herfindahl–Hirschman Index
ส่วนที่ต่อยอดคือการใช้ความกระจุกตัวกับการเปลี่ยนราคาปิดที่สนับสนุนทิศทาง แล้วแปลงเป็นจำนวนแท่งที่มีส่วนร่วมเชิงประสิทธิผล
ไม่คัดลอกโค้ดจากสคริปต์ Community สำหรับการพัฒนาครั้งนี้ หลักการคณิตศาสตร์พื้นฐานมีอยู่แล้ว ไม่ได้อ้างว่าเป็นสิ่งประดิษฐ์ใหม่ทั้งหมด และไม่ได้ใช้เกณฑ์การแข่งขันทางการค้าของ HHI มาตัดสินตลาดการเงิน
⏺️ Limitations and disclaimer
🔹 Distributed movement does not guarantee trend continuation.
🔹 Concentrated movement can occur during a valid repricing event.
🔹 Closing-price changes exclude intrabar price paths.
🔹 Sparse trading, session gaps and continuous-futures rolls can distort interpretation.
🔹 Changes can occur as old observations leave the rolling window.
🔹 Closed-bar confirmation delays state changes and does not prevent data revisions.
🔹 Numerical checks have been completed; TradingView compilation and market-data validation remain pending.
🔹 For educational and informational purposes only. No investment advice or return guarantee is provided.
⏺️ ข้อจำกัดและคำชี้แจง
🔹 การกระจายตัวไม่ได้รับประกันว่าแนวโน้มจะเดินหน้าต่อ
🔹 การกระจุกตัวอาจเกิดจากการปรับระดับราคาที่มีเหตุผลรองรับ
🔹 การเปลี่ยนราคาปิดไม่สะท้อนเส้นทางราคาทั้งหมดภายในแท่ง
🔹 การซื้อขายเบาบาง Gap ระหว่าง Session และรอยต่อสัญญา Futures อาจทำให้ตีความคลาดเคลื่อน
🔹 ค่าสามารถเปลี่ยนเมื่อข้อมูลเก่าออกจากหน้าต่างคำนวณ
🔹 การรอแท่งปิดทำให้สถานะยืนยันช้าลง และไม่ป้องกันการแก้ไขข้อมูลย้อนหลัง
🔹 ตรวจสูตรเชิงตัวเลขแล้ว แต่ยังไม่ได้ compile ใน TradingView หรือทดสอบข้อมูลตลาดจริง
🔹 ใช้เพื่อการศึกษาและประกอบการวิเคราะห์ ไม่ใช่คำแนะนำการลงทุนหรือการรับประกันผลตอบแทน

Declinazione di responsabilità
Le informazioni e le pubblicazioni non sono intese come, e non costituiscono, consulenza o raccomandazioni finanziarie, di investimento, di trading o di altro tipo fornite o approvate da TradingView. Per ulteriori informazioni, consultare i Termini di utilizzo.
Declinazione di responsabilità
Le informazioni e le pubblicazioni non sono intese come, e non costituiscono, consulenza o raccomandazioni finanziarie, di investimento, di trading o di altro tipo fornite o approvate da TradingView. Per ulteriori informazioni, consultare i Termini di utilizzo.