Riemannian Dreamer Manifold Engine (RDME)
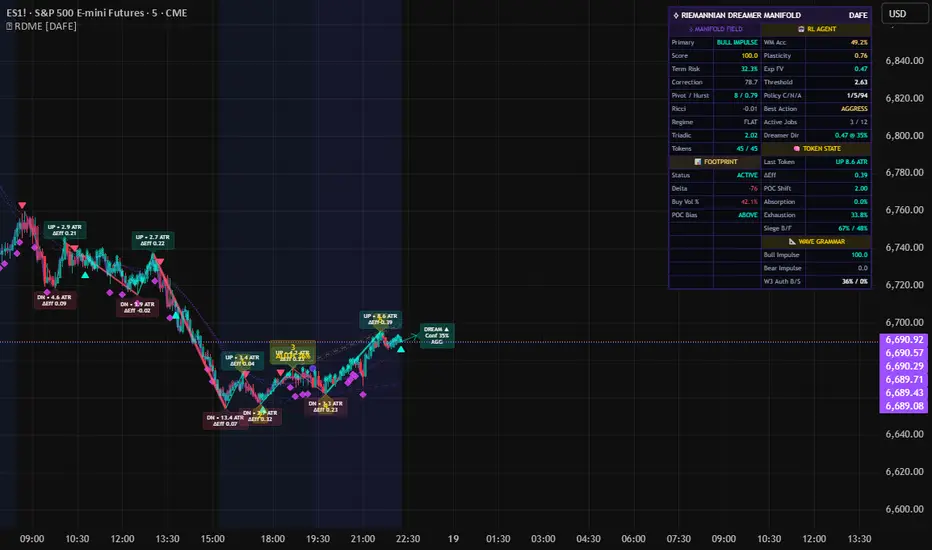
Riemannian Dreamer Manifold Engine (RDME)
Advanced Geometric and Predictive Modeling System
Where Differential Geometry and Adaptive Models Analyze Market Dynamics
🎓 THEORETICAL FOUNDATION
The Riemannian Dreamer Manifold Engine (RDME) represents a paradigm shift in market analysis, modeling the market as a living, curved geometric space. It is built upon four distinct but interconnected pillars: Riemannian geometry for market state, an adaptive wave system for structural analysis, a siege engine for level interaction, and a predictive model that simulates future possibilities.
📐 PILLAR 1: RIEMANNIAN METRIC & RICCI CURVATURE
Market as a Manifold:
RDME conceptualizes the market not as a flat plane, but as a dynamic 3-dimensional Riemannian manifold. Each point in this space is defined by three coordinates: Pressure, Health, and Liquidity. Price travels along geodesics (the straightest possible paths) on this evolving surface. The curvature of this manifold reveals the market's underlying state and areas of stress or expansion.
Ricci Curvature Calculation:
The engine estimates the Ricci scalar curvature (R) to classify the market's local geometry, providing a mathematical basis for regime detection:
R ≈ ∂²(vol_of_vol) / ∂t² − E[∂(vol_of_vol)/∂t]
Positive Curvature (R > 1.2): Spherical geometry. Indicates market contraction, stress, and high-probability reversal zones.
Negative Curvature (R < -1.2): Hyperbolic geometry. Signifies market expansion, confidence, and sustainable trend continuation.
Zero Curvature (R ≈ 0): Euclidean (flat) geometry. Represents a random walk or low-conviction environment.
🌊 PILLAR 2: ADAPTIVE WAVE TOKEN SYSTEM
Hurst Exponent Integration:
The system employs Rescaled Range (R/S) analysis to calculate the Hurst exponent (H), which dynamically modulates the pivot length for swing detection. This makes the wave analysis self-adapting to the market's "personality."
H = log(R/S) / log(n)
H > 0.5 (Persistent): The market is trending. The pivot length contracts to identify emerging waves quickly.
H < 0.5 (Anti-persistent): The market is mean-reverting. The pivot length expands to filter out noise and focus on significant turns.
Wave Token Generation:
Each confirmed swing generates a 'Wave Token,' a rich data structure containing over 18 features. This includes price/time data plus a deep analysis of the underlying order flow, such as delta efficiency, absorption rate, POC shift, value area acceptance, conviction, exhaustion, and trap risk. This tokenized data forms the basis for the Elliott Wave grammar analysis.
🏰 PILLAR 3: SIEGE ENGINE — STRUCTURAL GEOMETRY
Dynamic Level Analysis:
The Siege Engine identifies critical structural levels by projecting dynamic trendlines from consecutive swing points. It then scans for price interactions (sieges) within an ATR-scaled tolerance band.
Siege Metrics Calculation:
For each siege zone, the engine computes:
Hit Count & Energy Decay: Measures how many times a level has been tested and if its strength is diminishing.
Delta Alignment: Confirms if order flow supports or rejects the level.
Break/Fail Probability: Calculates the likelihood of a level breaking or holding based on a combination of decay, pressure, and delta.
Third-Push Detection: Identifies classical exhaustion patterns at key structures.
🤖 PILLAR 4: DREAMER ADAPTIVE WORLD MODEL
Predictive World Model:
The Dreamer is a linear world model that learns the market's dynamics. It predicts the next bar's manifold coordinates from the current state.
ŝ(t+1) = W · s(t) + b
The error between its prediction and reality drives learning, novelty detection (regime change), and plasticity (learning rate).
Imagination and Policy Optimization:
Imagination Rollouts: The Dreamer simulates thousands of potential future paths to evaluate the value of different actions.
Group Relative Policy Optimization (GRPO): This is a policy optimization system that evaluates three action modes (Conservative, Neutral, Aggressive) by tracking the realized performance of its past trades. It learns which mode is most profitable in the current market and adjusts the signal threshold accordingly.
🔧 COMPREHENSIVE INPUT SYSTEM
Core Manifold Group
History Buffer (500-3000, Default: 1400): The number of bars of market data retained. Larger values provide deeper context for wave analysis at the cost of more memory.
Max Wave Tokens (15-120, Default: 45): The maximum number of completed swings stored. The Elliott Wave mapper uses the last 5 tokens.
Health Lookback (6-40, Default: 14): The window for calculating directional efficiency, a core component of the manifold.
Liquidity Windows (Fast: 3-20, Slow: 10-80): Defines the lookback periods for short-term and long-term order flow (delta) accumulation.
Z-Score Lookback (20-200, Default: 60): The normalization period for all internal features, ensuring the system is self-adapting across different assets.
Hurst Period (30-200, Default: 80): The lookback for the Hurst exponent. A key parameter for adapting the swing detection to market conditions.
Swing Pivots (Base: 2-20, Min: 2-20, Max: 3-40): Controls the base sensitivity and allowable range of the Hurst-modulated pivot detector.
Footprint Group
Ticks Per Row (Min: 1, Default: 100): Sets the tick resolution for footprint data. If footprint data is unavailable, the system falls back to an OHLCV proxy.
Value Area % (1-99, Default: 70): Defines the percentage of volume to be included in the Value Area calculation.
Dreamer Predictive Engine Group
Base Model Threshold (Default: 2.1): The master sensitivity control. This is the minimum triadic verdict score required to register a trade, before GRPO adjustments.
World Model LR (Default: 0.009): The base learning rate for the Dreamer's world model. This is internally scaled by plasticity, accelerating learning in novel market conditions.
Imagination Depth (3-14, Default: 6): How many bars into the future the Dreamer simulates during its rollouts.
GRPO Eval Horizon (5-50, Default: 16): The number of bars after which a registered trade job is evaluated for its profit/loss, feeding the policy optimizer.
GRPO Update Frequency (1-50, Default: 9): How often the GRPO policy updates based on newly evaluated trade jobs.
Max Active Jobs (1-30, Default: 12): The maximum number of concurrent trade jobs the predictive engine can track.
🎨 ADVANCED VISUAL SYSTEM
Riemannian Manifold Field Visualization
The core of the visual system, this multi-layered field represents the local geometry of the market. It expands in hyperbolic (trending) regimes and contracts in spherical (reversal) regimes, creating dynamic zones of potential support and resistance that are derived from the market's mathematical state.

Wave Grammar & Elliott Mapper
The Adaptive Wave Token system plots lines for each swing, with thickness indicating the wave's degree. When a high-probability 5-wave impulse or 3-wave correction is detected, it is automatically labeled ('1'-'5' or 'A'-'C'), providing clear structural context. Labels include critical data like 'Wave 3 Authority' and 'Wave 5 Terminal Risk' percentages.

Siege Corridors
When the Siege Engine identifies a structural test in progress, it projects a corridor onto the chart. This visualizes the dynamic trendline and its ATR-based tolerance zone, highlighting areas of intense price negotiation.

Dreamer Model Projections
The Dreamer visualizes its highest-conviction future path as a projection arrow, pointing from the current price to its expected location after the 'Imagination Depth' period. A cone of uncertainty visualizes the model's confidence, widening as confidence decreases.

Geodesics and Parallel Transport
Geodesic Paths: Dotted lines represent the 'straightest possible path' on the curved manifold, acting as a dynamic, geometrically-derived moving average.

Parallel Transport Particles: Flowing particles around price provide a visual representation of market energy and directional intent on the manifold.

Curvature-Driven Background
The chart background subtly changes color to reflect the dominant geometric regime, providing at-a-glance context:
Green (Spherical): Contracting, reversal-prone market.
Red (Hyperbolic): Expanding, trending market.
Blue (Corrective): A valid corrective wave structure is active.

📊 INSTITUTIONAL-GRADE DASHBOARD
Manifold Field Section
Primary Structure: Displays the current highest-scoring wave pattern (BULL IMPULSE, BEAR IMPULSE, CORRECTION).
Score: The confidence score (0-100) of the primary structure.
Terminal Risk: For impulse waves, shows the calculated risk of exhaustion in the fifth wave.
Ricci & Regime: Displays the real-time Ricci curvature value and the resulting geometric regime (HYPERBOLIC, SPHERICAL, FLAT).
Triadic Verdict: The combined score from the Pressure, Health, and Liquidity manifold dimensions.
Dreamer Model Section
WM Accuracy: The current accuracy of the Dreamer's world model in predicting market dynamics.
Plasticity: How quickly the model is learning; high plasticity indicates a regime change.
Policy C/N/A: Shows the GRPO-learned probabilities for Conservative, Neutral, and Aggressive action modes.
Best Action: The action mode the Dreamer currently prefers based on its simulations.
Threshold: The current, GRPO-adjusted threshold the triadic verdict must exceed for a signal.
Token State & Footprint Section
Last Token: Key metrics from the most recently completed wave, including direction and magnitude.
ΔEff (Delta Efficiency): Shows how effective the order flow was in moving price during the last wave.
Absorption & Exhaustion: Real-time display of absorption and exhaustion percentages within the last wave.
Siege B/F: Displays the calculated Break and Fail probabilities for the structure tested in the last wave.
Footprint Status: Confirms if the system is using live footprint data or the OHLCV proxy, and displays the current bar's delta.

🎯 SIGNAL GENERATION LOGIC
Confluence of Pillars
RDME signals are not based on a single condition but on a confluence across all four pillars, ensuring a holistic view of the market:
Manifold Geometry: The underlying Ricci curvature must support the trade's direction (e.g., hyperbolic expansion for a trend-following signal).
Wave Structure: The Elliott Wave mapper must identify a high-probability impulse or corrective structure that provides context for the trade.
Siege Engine: The interaction with key structural levels must confirm the trade's thesis (e.g., a breakout with high break probability).
Dreamer's Verdict: The world model must project a favorable future value (positive expected FV) for taking the trade, and the triadic verdict must exceed the GRPO-adjusted threshold.
Signal Philosophy
The system embodies a philosophy of patience and precision. It is designed to filter out low-conviction noise and highlight only those moments where the mathematical, structural, and predictive models of the market are in deep alignment.
🚀 ADVANCED TRADING STRATEGIES
The Geometric Convergence Method
This strategy focuses on entering trades when geometric and structural signals align. Wait for price to approach a key level identified by the Siege Engine while the manifold is in a favorable state (e.g., spherical curvature near a support level for a long). The entry is confirmed when a high-scoring Wave Token and a supportive Dreamer projection align.
The Regime Transition Strategy
This involves trading the shift between geometric states. An entry can be planned when the Ricci curvature crosses its threshold, indicating a shift from a flat/contracting market to an expanding (hyperbolic) one. This strategy aims to capture the beginning of new, powerful trends.
The Wave Grammar Momentum Strategy
Focus on high-probability impulse waves. After the system identifies a Wave 1 and a Wave 2, a trader can look to enter during Wave 3, which is often the strongest. The entry should be validated by high 'Wave 3 Authority' metrics on the dashboard, indicating strong underlying order flow.
The Siege Engine Break/Fade Strategy
Utilize the Siege Engine's break/fail probabilities. For a breakout trade, look for a high break probability (>70%) coupled with strong delta alignment. For a fade trade, look for a high fail probability at a key level, often confirmed by a 'third-push' exhaustion flag and high absorption in the Wave Token data.
⚖️ RESPONSIBLE USAGE AND LIMITATIONS
Understanding Model Boundaries
Topology Changes: Markets are complex systems. Sudden, un-modeled events can cause the manifold's geometry to "tear," leading to unpredictable behavior.
No Guarantees: This is a sophisticated decision-support tool, not a crystal ball. It provides a probabilistic edge, not certainty.
Data Dependency: The highest quality analysis requires footprint data. While the OHLCV proxy is robust, performance may vary.
Risk Management is Paramount
The mathematical sophistication of RDME is not a substitute for disciplined risk management. Always use proper position sizing, stop-loss orders, and trade within a well-defined personal trading plan.
🔮 CONCLUSION
The Riemannian Dreamer Manifold Engine is more than an indicator; it is a new lens through which to view the market. It moves beyond traditional price-and-time analysis to interpret the market as a dynamic, geometric object with learnable dynamics. By unifying differential geometry, adaptive wave theory, structural analysis, and a sophisticated adaptive world model,
RDME provides a comprehensive and deeply contextual view of market behavior.
It translates the abstract language of advanced mathematics into intuitive visualizations and high-probability trading signals, empowering traders to navigate the complexities of modern markets with unprecedented insight.
Trade with geometric context. Trade with computational foresight. Trade with the RDME.
— Dskyz
Advanced Geometric and Predictive Modeling System
Where Differential Geometry and Adaptive Models Analyze Market Dynamics
🎓 THEORETICAL FOUNDATION
The Riemannian Dreamer Manifold Engine (RDME) represents a paradigm shift in market analysis, modeling the market as a living, curved geometric space. It is built upon four distinct but interconnected pillars: Riemannian geometry for market state, an adaptive wave system for structural analysis, a siege engine for level interaction, and a predictive model that simulates future possibilities.
📐 PILLAR 1: RIEMANNIAN METRIC & RICCI CURVATURE
Market as a Manifold:
RDME conceptualizes the market not as a flat plane, but as a dynamic 3-dimensional Riemannian manifold. Each point in this space is defined by three coordinates: Pressure, Health, and Liquidity. Price travels along geodesics (the straightest possible paths) on this evolving surface. The curvature of this manifold reveals the market's underlying state and areas of stress or expansion.
Ricci Curvature Calculation:
The engine estimates the Ricci scalar curvature (R) to classify the market's local geometry, providing a mathematical basis for regime detection:
R ≈ ∂²(vol_of_vol) / ∂t² − E[∂(vol_of_vol)/∂t]
Positive Curvature (R > 1.2): Spherical geometry. Indicates market contraction, stress, and high-probability reversal zones.
Negative Curvature (R < -1.2): Hyperbolic geometry. Signifies market expansion, confidence, and sustainable trend continuation.
Zero Curvature (R ≈ 0): Euclidean (flat) geometry. Represents a random walk or low-conviction environment.
🌊 PILLAR 2: ADAPTIVE WAVE TOKEN SYSTEM
Hurst Exponent Integration:
The system employs Rescaled Range (R/S) analysis to calculate the Hurst exponent (H), which dynamically modulates the pivot length for swing detection. This makes the wave analysis self-adapting to the market's "personality."
H = log(R/S) / log(n)
H > 0.5 (Persistent): The market is trending. The pivot length contracts to identify emerging waves quickly.
H < 0.5 (Anti-persistent): The market is mean-reverting. The pivot length expands to filter out noise and focus on significant turns.
Wave Token Generation:
Each confirmed swing generates a 'Wave Token,' a rich data structure containing over 18 features. This includes price/time data plus a deep analysis of the underlying order flow, such as delta efficiency, absorption rate, POC shift, value area acceptance, conviction, exhaustion, and trap risk. This tokenized data forms the basis for the Elliott Wave grammar analysis.
🏰 PILLAR 3: SIEGE ENGINE — STRUCTURAL GEOMETRY
Dynamic Level Analysis:
The Siege Engine identifies critical structural levels by projecting dynamic trendlines from consecutive swing points. It then scans for price interactions (sieges) within an ATR-scaled tolerance band.
Siege Metrics Calculation:
For each siege zone, the engine computes:
Hit Count & Energy Decay: Measures how many times a level has been tested and if its strength is diminishing.
Delta Alignment: Confirms if order flow supports or rejects the level.
Break/Fail Probability: Calculates the likelihood of a level breaking or holding based on a combination of decay, pressure, and delta.
Third-Push Detection: Identifies classical exhaustion patterns at key structures.
🤖 PILLAR 4: DREAMER ADAPTIVE WORLD MODEL
Predictive World Model:
The Dreamer is a linear world model that learns the market's dynamics. It predicts the next bar's manifold coordinates from the current state.
ŝ(t+1) = W · s(t) + b
The error between its prediction and reality drives learning, novelty detection (regime change), and plasticity (learning rate).
Imagination and Policy Optimization:
Imagination Rollouts: The Dreamer simulates thousands of potential future paths to evaluate the value of different actions.
Group Relative Policy Optimization (GRPO): This is a policy optimization system that evaluates three action modes (Conservative, Neutral, Aggressive) by tracking the realized performance of its past trades. It learns which mode is most profitable in the current market and adjusts the signal threshold accordingly.
🔧 COMPREHENSIVE INPUT SYSTEM
Core Manifold Group
History Buffer (500-3000, Default: 1400): The number of bars of market data retained. Larger values provide deeper context for wave analysis at the cost of more memory.
Max Wave Tokens (15-120, Default: 45): The maximum number of completed swings stored. The Elliott Wave mapper uses the last 5 tokens.
Health Lookback (6-40, Default: 14): The window for calculating directional efficiency, a core component of the manifold.
Liquidity Windows (Fast: 3-20, Slow: 10-80): Defines the lookback periods for short-term and long-term order flow (delta) accumulation.
Z-Score Lookback (20-200, Default: 60): The normalization period for all internal features, ensuring the system is self-adapting across different assets.
Hurst Period (30-200, Default: 80): The lookback for the Hurst exponent. A key parameter for adapting the swing detection to market conditions.
Swing Pivots (Base: 2-20, Min: 2-20, Max: 3-40): Controls the base sensitivity and allowable range of the Hurst-modulated pivot detector.
Footprint Group
Ticks Per Row (Min: 1, Default: 100): Sets the tick resolution for footprint data. If footprint data is unavailable, the system falls back to an OHLCV proxy.
Value Area % (1-99, Default: 70): Defines the percentage of volume to be included in the Value Area calculation.
Dreamer Predictive Engine Group
Base Model Threshold (Default: 2.1): The master sensitivity control. This is the minimum triadic verdict score required to register a trade, before GRPO adjustments.
World Model LR (Default: 0.009): The base learning rate for the Dreamer's world model. This is internally scaled by plasticity, accelerating learning in novel market conditions.
Imagination Depth (3-14, Default: 6): How many bars into the future the Dreamer simulates during its rollouts.
GRPO Eval Horizon (5-50, Default: 16): The number of bars after which a registered trade job is evaluated for its profit/loss, feeding the policy optimizer.
GRPO Update Frequency (1-50, Default: 9): How often the GRPO policy updates based on newly evaluated trade jobs.
Max Active Jobs (1-30, Default: 12): The maximum number of concurrent trade jobs the predictive engine can track.
🎨 ADVANCED VISUAL SYSTEM
Riemannian Manifold Field Visualization
The core of the visual system, this multi-layered field represents the local geometry of the market. It expands in hyperbolic (trending) regimes and contracts in spherical (reversal) regimes, creating dynamic zones of potential support and resistance that are derived from the market's mathematical state.
Wave Grammar & Elliott Mapper
The Adaptive Wave Token system plots lines for each swing, with thickness indicating the wave's degree. When a high-probability 5-wave impulse or 3-wave correction is detected, it is automatically labeled ('1'-'5' or 'A'-'C'), providing clear structural context. Labels include critical data like 'Wave 3 Authority' and 'Wave 5 Terminal Risk' percentages.
Siege Corridors
When the Siege Engine identifies a structural test in progress, it projects a corridor onto the chart. This visualizes the dynamic trendline and its ATR-based tolerance zone, highlighting areas of intense price negotiation.
Dreamer Model Projections
The Dreamer visualizes its highest-conviction future path as a projection arrow, pointing from the current price to its expected location after the 'Imagination Depth' period. A cone of uncertainty visualizes the model's confidence, widening as confidence decreases.
Geodesics and Parallel Transport
Geodesic Paths: Dotted lines represent the 'straightest possible path' on the curved manifold, acting as a dynamic, geometrically-derived moving average.
Parallel Transport Particles: Flowing particles around price provide a visual representation of market energy and directional intent on the manifold.
Curvature-Driven Background
The chart background subtly changes color to reflect the dominant geometric regime, providing at-a-glance context:
Green (Spherical): Contracting, reversal-prone market.
Red (Hyperbolic): Expanding, trending market.
Blue (Corrective): A valid corrective wave structure is active.
📊 INSTITUTIONAL-GRADE DASHBOARD
Manifold Field Section
Primary Structure: Displays the current highest-scoring wave pattern (BULL IMPULSE, BEAR IMPULSE, CORRECTION).
Score: The confidence score (0-100) of the primary structure.
Terminal Risk: For impulse waves, shows the calculated risk of exhaustion in the fifth wave.
Ricci & Regime: Displays the real-time Ricci curvature value and the resulting geometric regime (HYPERBOLIC, SPHERICAL, FLAT).
Triadic Verdict: The combined score from the Pressure, Health, and Liquidity manifold dimensions.
Dreamer Model Section
WM Accuracy: The current accuracy of the Dreamer's world model in predicting market dynamics.
Plasticity: How quickly the model is learning; high plasticity indicates a regime change.
Policy C/N/A: Shows the GRPO-learned probabilities for Conservative, Neutral, and Aggressive action modes.
Best Action: The action mode the Dreamer currently prefers based on its simulations.
Threshold: The current, GRPO-adjusted threshold the triadic verdict must exceed for a signal.
Token State & Footprint Section
Last Token: Key metrics from the most recently completed wave, including direction and magnitude.
ΔEff (Delta Efficiency): Shows how effective the order flow was in moving price during the last wave.
Absorption & Exhaustion: Real-time display of absorption and exhaustion percentages within the last wave.
Siege B/F: Displays the calculated Break and Fail probabilities for the structure tested in the last wave.
Footprint Status: Confirms if the system is using live footprint data or the OHLCV proxy, and displays the current bar's delta.
🎯 SIGNAL GENERATION LOGIC
Confluence of Pillars
RDME signals are not based on a single condition but on a confluence across all four pillars, ensuring a holistic view of the market:
Manifold Geometry: The underlying Ricci curvature must support the trade's direction (e.g., hyperbolic expansion for a trend-following signal).
Wave Structure: The Elliott Wave mapper must identify a high-probability impulse or corrective structure that provides context for the trade.
Siege Engine: The interaction with key structural levels must confirm the trade's thesis (e.g., a breakout with high break probability).
Dreamer's Verdict: The world model must project a favorable future value (positive expected FV) for taking the trade, and the triadic verdict must exceed the GRPO-adjusted threshold.
Signal Philosophy
The system embodies a philosophy of patience and precision. It is designed to filter out low-conviction noise and highlight only those moments where the mathematical, structural, and predictive models of the market are in deep alignment.
🚀 ADVANCED TRADING STRATEGIES
The Geometric Convergence Method
This strategy focuses on entering trades when geometric and structural signals align. Wait for price to approach a key level identified by the Siege Engine while the manifold is in a favorable state (e.g., spherical curvature near a support level for a long). The entry is confirmed when a high-scoring Wave Token and a supportive Dreamer projection align.
The Regime Transition Strategy
This involves trading the shift between geometric states. An entry can be planned when the Ricci curvature crosses its threshold, indicating a shift from a flat/contracting market to an expanding (hyperbolic) one. This strategy aims to capture the beginning of new, powerful trends.
The Wave Grammar Momentum Strategy
Focus on high-probability impulse waves. After the system identifies a Wave 1 and a Wave 2, a trader can look to enter during Wave 3, which is often the strongest. The entry should be validated by high 'Wave 3 Authority' metrics on the dashboard, indicating strong underlying order flow.
The Siege Engine Break/Fade Strategy
Utilize the Siege Engine's break/fail probabilities. For a breakout trade, look for a high break probability (>70%) coupled with strong delta alignment. For a fade trade, look for a high fail probability at a key level, often confirmed by a 'third-push' exhaustion flag and high absorption in the Wave Token data.
⚖️ RESPONSIBLE USAGE AND LIMITATIONS
Understanding Model Boundaries
Topology Changes: Markets are complex systems. Sudden, un-modeled events can cause the manifold's geometry to "tear," leading to unpredictable behavior.
No Guarantees: This is a sophisticated decision-support tool, not a crystal ball. It provides a probabilistic edge, not certainty.
Data Dependency: The highest quality analysis requires footprint data. While the OHLCV proxy is robust, performance may vary.
Risk Management is Paramount
The mathematical sophistication of RDME is not a substitute for disciplined risk management. Always use proper position sizing, stop-loss orders, and trade within a well-defined personal trading plan.
🔮 CONCLUSION
The Riemannian Dreamer Manifold Engine is more than an indicator; it is a new lens through which to view the market. It moves beyond traditional price-and-time analysis to interpret the market as a dynamic, geometric object with learnable dynamics. By unifying differential geometry, adaptive wave theory, structural analysis, and a sophisticated adaptive world model,
RDME provides a comprehensive and deeply contextual view of market behavior.
It translates the abstract language of advanced mathematics into intuitive visualizations and high-probability trading signals, empowering traders to navigate the complexities of modern markets with unprecedented insight.
Trade with geometric context. Trade with computational foresight. Trade with the RDME.
— Dskyz

Declinazione di responsabilità
Le informazioni e le pubblicazioni non sono intese come, e non costituiscono, consulenza o raccomandazioni finanziarie, di investimento, di trading o di altro tipo fornite o approvate da TradingView. Per ulteriori informazioni, consultare i Termini di utilizzo.
Declinazione di responsabilità
Le informazioni e le pubblicazioni non sono intese come, e non costituiscono, consulenza o raccomandazioni finanziarie, di investimento, di trading o di altro tipo fornite o approvate da TradingView. Per ulteriori informazioni, consultare i Termini di utilizzo.