OPEN-SOURCE SCRIPT
XG Boost Lite: Reversals | GainzAlgo
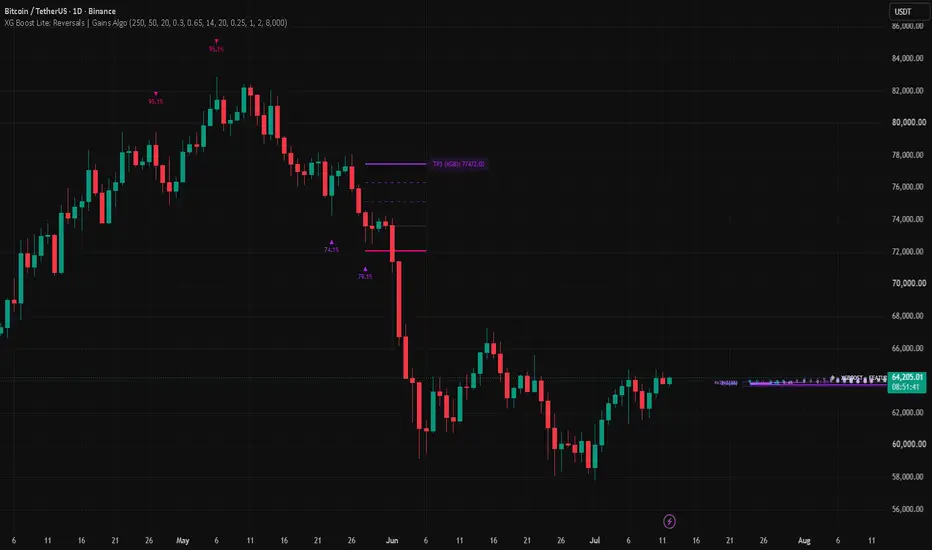
We are excited to release this indicator, which uses our brand-new Arbor library for gradient boosting! This engine brings true, high-performance machine learning natively into Pine Script v6, bypassing the need for external webhooks or API layers. By utilizing iterative, tree-based models on your chart, XGBoost Lite: Reversals adapts directly to the historical structure of the asset you are trading, identifying precise pivot exhaustion points with high statistical conviction.
🧠 Understanding Gradient Boosting & XGBoost
To trade successfully with machine learning, it helps to understand exactly what is happening beneath the hood of the asset's data.The Core TheoryGradient Boosting is a powerful machine learning technique used for regression and classification tasks. Unlike deep learning networks that process data through abstract node layers, gradient boosting relies on an ensemble of simple decision trees, often called "weak learners" or "stumps".
The training process works sequentially:
What Makes XGBoost Special?
XGBoost (Extreme Gradient Boosting) optimizes this framework for speed, scalability, and performance. It applies strict regularization techniques to minimize overfitting, ensuring the model doesn't just "memorize" past market noise but instead learns genuine structural behaviors.By evaluating multiple market features simultaneously, it estimates the probability of a specific event occurring.
🛠️ About the Indicator
XGBoost Lite: Reversals is a machine learning-driven technical indicator designed to catch exhaustion and reversal setups.
The Machine Learning Pipeline
The Core Features Evaluated
The model processes a combination of multi-dimensional market inputs to generate a unified prediction:
📊 How to Use the Indicator
Visualizing Signals

When a market pivot is detected (e.g., a structural swing low or high) and the classifier hits your target confirmation probability, a signal arrow prints on the chart displaying the mathematical certainty ($e.g., 74.2\%$) of the reversal.
⚙️ The Settings Inputs
The indicator’s interface is neatly categorized into three primary functional groups:
⚙️ XGBoost Model Settings:
🛡️ Target & Risk Management

📈 How to Trade the Indicator
Trading with the machine learning model requires blending quantitative probabilities with standard structural execution:
The Entry: Wait for a Bullish (Neon Purple) or Bearish (Neon Pink) arrow to finalize on a closed candle. The percentage printed indicates the model's confidence.
Placing Risk: The system automatically draws a solid line anchoring your Stop Loss tightly to the local structural wick pivot, applying an ATR buffer to account for minor noise.
Scaling Targets:
📊 Deep Dive: The Feature Importance & Scatter Plot Dashboard

The dashboard rendered on the right side of the chart acts as the "brain" of the indicator. It provides real-time transparency into exactly how the machine learning model is weighing data and evaluating current market conditions.
Feature Importance Bars (The Relative Weights): The horizontal progress bars display the mathematical percentage weight allocated to each of the four indicators processed during the model's most recent training cycle. These values change dynamically every time the model triggers a retraining block (default: every 50 bars) as it adapts to shifting market conditions. For example, if the market moves into a heavy trending phase, you will notice metrics like the ADX or Z-Score capture a higher percentage of the model's attention, whereas the RSI will frequently become the dominant driver if the asset is range-bound.
The Holographic Scatter Plot (Historical Feature Density): Layered over the progress bars is an advanced distribution scatter plot consisting of individual circular glyphs (○, ◉, ●) that plot a rolling record of the last 30 historical signal points. The horizontal position of each dot shows exactly where the feature value landed relative to its historical extremes (0 on the far left, 1 on the far right). The script introduces a subtle vertical "jitter" to separate these dots so you can visually identify high-density clusters where successful reversal setups frequently occur, while the shifting style of the glyphs flags tightly packed clusters of solid nodes (●) to indicate highly concentrated mathematical sweet spots discovered by the XGBoost classifier.
🧠 Understanding Gradient Boosting & XGBoost
To trade successfully with machine learning, it helps to understand exactly what is happening beneath the hood of the asset's data.The Core TheoryGradient Boosting is a powerful machine learning technique used for regression and classification tasks. Unlike deep learning networks that process data through abstract node layers, gradient boosting relies on an ensemble of simple decision trees, often called "weak learners" or "stumps".
The training process works sequentially:
- The Initial Guess: The model makes a basic baseline prediction.Calculating the Error (Residuals): It checks where its prediction missed the actual historical market outcome.
- Correcting the Mistakes: A new decision tree is built specifically to predict those errors (the gradient of the loss function).
- Iterative Learning: The model repeats this process for several rounds. Each new tree focuses entirely on correcting the flaws of the previous ones, scaling its adjustments by a Learning Rate to maintain stability.
What Makes XGBoost Special?
XGBoost (Extreme Gradient Boosting) optimizes this framework for speed, scalability, and performance. It applies strict regularization techniques to minimize overfitting, ensuring the model doesn't just "memorize" past market noise but instead learns genuine structural behaviors.By evaluating multiple market features simultaneously, it estimates the probability of a specific event occurring.
🛠️ About the Indicator
XGBoost Lite: Reversals is a machine learning-driven technical indicator designed to catch exhaustion and reversal setups.
The Machine Learning Pipeline
- Dual Engines: The script fits four separate models simultaneously—a classifier and a regressor for Longs, and a classifier and a regressor for Shorts.
- Dynamic Retraining: Rather than remaining static, the model automatically flushes its memory and retrains its internal mathematical weights every n bars to adapt to evolving market regimes.
- Strict Non-Repainting Execution: A critical upgrade in this framework forces features and calculations to compute and lock strictly on bar close. Signals, dynamic entry points, and risk metrics are only printed once the triggering candle is finalized, ensuring what you see on the historical chart matches real-time execution perfectly.
The Core Features Evaluated
The model processes a combination of multi-dimensional market inputs to generate a unified prediction:
- RSI (14): Evaluates traditional momentum expansion and contraction.
- Relative Volume (20): Evaluates institutional engagement by dividing current volume against its 20-period SMA.
- Z-Score (20): Measures how far the current price has deviated from its statistical mean.
- ADX (14): Gauges the overall strength of the macro trend to prevent trading directly into a runaway freight train.
📊 How to Use the Indicator
- The Real-Time Dashboard: When applied to your chart, the indicator renders an advanced Feature Importance Scatter Plot in the right-hand margin.
- Distribution Scatter: The horizontal bars plot the historical density of successful signals. Darker, tightly packed nodes represent highly concentrated, high-probability clusters discovered by the algorithm.
Visualizing Signals
When a market pivot is detected (e.g., a structural swing low or high) and the classifier hits your target confirmation probability, a signal arrow prints on the chart displaying the mathematical certainty ($e.g., 74.2\%$) of the reversal.
⚙️ The Settings Inputs
The indicator’s interface is neatly categorized into three primary functional groups:
⚙️ XGBoost Model Settings:
- Training Lookback (Bars): (Default: 250) The historical window used to feed the training arrays. Max capped at 300 to remain computational within Pine Script limits.
- Retrain Frequency: (Default: 50) Determines how often (in bars) the model recalibrates its trees. Boosting Rounds: (Default: 20) The number of sequential trees (stumps) trained per model. Higher numbers capture deeper complexities but risk overfitting.
- Learning Rate: (Default: 0.3) The step size applied to each boosting round to prevent the model from learning too quickly. Min Probability for Signal: (Default: 0.65) The minimum confidence threshold ($65\%$) required from the classification model to trigger an active trade.
- ADX Length / Minimum Filter: (Default: 14 / 20.0) Prevents counter-trend signals if the prevailing macro trend is too strong.
🛡️ Target & Risk Management
- SL Wick Buffer ×ATR: (Default: 0.25) Sets how much breathing room is given below a swing low wick or above a swing high wick, scaled by ATR.
- TP1 ×Risk (R-multiple): (Default: 1.0) Targets a clean 1:1 Risk-to-Reward ratio for the initial profit take.
- TP3 Min ×Risk (Floor): (Default: 2.0) The minimum target floor for the machine learning regression objective.
- Break-Even After TP1: (Default: True) Automatically moves the Stop Loss to the exact entry price the moment TP1 is captured, eliminating risk on the remainder of the trade.
📈 How to Trade the Indicator
Trading with the machine learning model requires blending quantitative probabilities with standard structural execution:
The Entry: Wait for a Bullish (Neon Purple) or Bearish (Neon Pink) arrow to finalize on a closed candle. The percentage printed indicates the model's confidence.
Placing Risk: The system automatically draws a solid line anchoring your Stop Loss tightly to the local structural wick pivot, applying an ATR buffer to account for minor noise.
Scaling Targets:
- Target 1 (TP1): Landed at a symmetrical 1:1 distance. When hit, the indicator dynamically updates your Stop Loss to your entry line, locking in a "scratch-or-better" runner.
- Target 2 (TP2): Represents the mathematical midpoint between your baseline risk and the macro ML objective.
- Target 3 (TP3): Driven directly by the XGBoost Regression Model. The regressor estimates the potential mathematical expansion based on current market features—if volatility is expanding, TP3 will automatically stretch further to ride major trend changes.
📊 Deep Dive: The Feature Importance & Scatter Plot Dashboard
The dashboard rendered on the right side of the chart acts as the "brain" of the indicator. It provides real-time transparency into exactly how the machine learning model is weighing data and evaluating current market conditions.
Feature Importance Bars (The Relative Weights): The horizontal progress bars display the mathematical percentage weight allocated to each of the four indicators processed during the model's most recent training cycle. These values change dynamically every time the model triggers a retraining block (default: every 50 bars) as it adapts to shifting market conditions. For example, if the market moves into a heavy trending phase, you will notice metrics like the ADX or Z-Score capture a higher percentage of the model's attention, whereas the RSI will frequently become the dominant driver if the asset is range-bound.
The Holographic Scatter Plot (Historical Feature Density): Layered over the progress bars is an advanced distribution scatter plot consisting of individual circular glyphs (○, ◉, ●) that plot a rolling record of the last 30 historical signal points. The horizontal position of each dot shows exactly where the feature value landed relative to its historical extremes (0 on the far left, 1 on the far right). The script introduces a subtle vertical "jitter" to separate these dots so you can visually identify high-density clusters where successful reversal setups frequently occur, while the shifting style of the glyphs flags tightly packed clusters of solid nodes (●) to indicate highly concentrated mathematical sweet spots discovered by the XGBoost classifier.
Script open-source
Nello spirito di TradingView, l'autore di questo script lo ha reso open source, in modo che i trader possano esaminarne e verificarne la funzionalità. Complimenti all'autore! Sebbene sia possibile utilizzarlo gratuitamente, ricordiamo che la ripubblicazione del codice è soggetta al nostro Regolamento.

Get GainzAlgo only at gainzalgo.com
Declinazione di responsabilità
Le informazioni e le pubblicazioni non sono intese come, e non costituiscono, consulenza o raccomandazioni finanziarie, di investimento, di trading o di altro tipo fornite o approvate da TradingView. Per ulteriori informazioni, consultare i Termini di utilizzo.
Script open-source
Nello spirito di TradingView, l'autore di questo script lo ha reso open source, in modo che i trader possano esaminarne e verificarne la funzionalità. Complimenti all'autore! Sebbene sia possibile utilizzarlo gratuitamente, ricordiamo che la ripubblicazione del codice è soggetta al nostro Regolamento.
Get GainzAlgo only at gainzalgo.com
Declinazione di responsabilità
Le informazioni e le pubblicazioni non sono intese come, e non costituiscono, consulenza o raccomandazioni finanziarie, di investimento, di trading o di altro tipo fornite o approvate da TradingView. Per ulteriori informazioni, consultare i Termini di utilizzo.