OPEN-SOURCE SCRIPT
Aggiornato Supply-Demand Imbalance Prevalence (SDI-P)
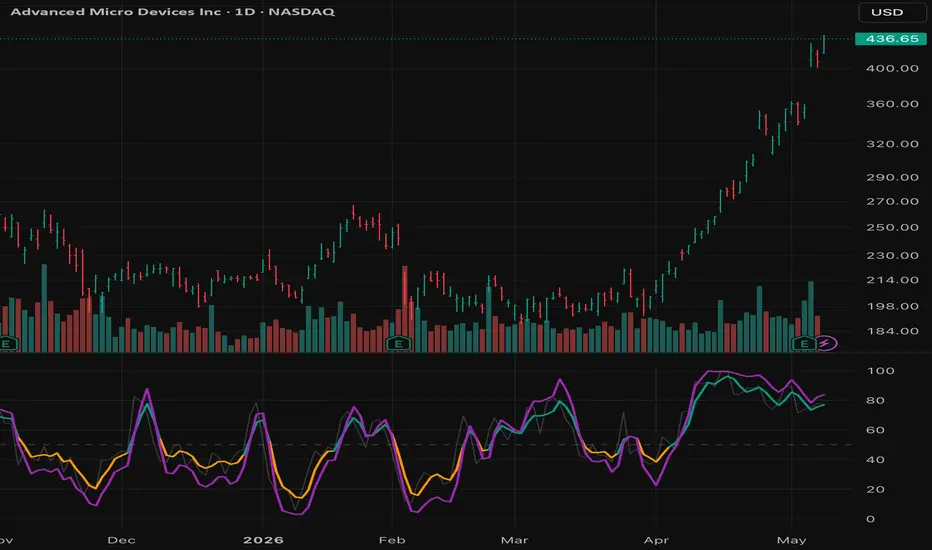
Supply-Demand Imbalance Prevalence (SDI-P)
Overview
Most indicators focus on candle closes or volume in isolation. SDI-P (Supply-Demand Imbalance Prevalence) looks deeper into intra-bar price dynamics by analyzing buying and selling pressure. It quantifies which side is more successful at pushing the price away from the extremes, then calculates how consistently that dominance occurs over a historical window.
The Core Logic
For every bar, the indicator calculates the Supply Pressure (S)—the distance from the High to the Close—and the Demand Pressure (B)—the distance from the Close to the Low. The indicator, then calculates the difference D between the two:
Based on the above differences, the indicator calculates the percentage of bars where buying pressure prevailed over the selling pressure over a lookback window of a user-specified size. A number of different weighting schemes can be applied during this computation as described below.
Key Features
How to Read the Lines
Multi-Timeframe Strategy: Micro Signals vs. Macro Context
To get the most out of SDI-P, it should be viewed as a fractal tool. The "prevalence" of demand on a Weekly chart means something very different than on a daily chart.
1. Finer Timescales (Daily / Intraday): The Early Warning System
Use lower timeframes to spot **incipient trend shifts** before they are obvious in the price structure.
Furthermore, consider the behavior of SDI-P in conjunction with price trajectory for detecting. This is often effective for detecting divergences before price trajectory shifts. For example: If price is continuing trending higher, but SDI-P is declining and making lower highs, it is a strong indicator of buyers' exhaustion and a warning of an upcoming price decline.
2. Coarser Timescales (Weekly / Monthly): The Strategic Anchor
Higher timeframes provide the structural context and serve to confirm durability of longer-term trends.
Overview
Most indicators focus on candle closes or volume in isolation. SDI-P (Supply-Demand Imbalance Prevalence) looks deeper into intra-bar price dynamics by analyzing buying and selling pressure. It quantifies which side is more successful at pushing the price away from the extremes, then calculates how consistently that dominance occurs over a historical window.
The Core Logic
For every bar, the indicator calculates the Supply Pressure (S)—the distance from the High to the Close—and the Demand Pressure (B)—the distance from the Close to the Low. The indicator, then calculates the difference D between the two:
- D = B - S
- D > 0$: Buying pressure exceeded selling pressure.
- D < 0$: Selling pressure exceeded buying pressure.
Based on the above differences, the indicator calculates the percentage of bars where buying pressure prevailed over the selling pressure over a lookback window of a user-specified size. A number of different weighting schemes can be applied during this computation as described below.
Key Features
- Dual Weighting Modes: Choose Uniform for a raw win-rate or SDI Weighted (default) to give more "voting power" to bars with higher supply-demand imbalances.
- Volume Weighting (Toggleable): Factor in capital commitment. A "win" on high volume is treated as more significant than a win on thin liquidity.
- Quantile Normalization (The Purple Line): This shows you how the current buyer/seller prevalence compares to the last Q bars. A reading above 80 means the current intensity is in the top 20% of historical readings. This line is displayed only when there are at least Q bars of history available.
How to Read the Lines
- Prevalence (Gray Line): The raw, bar-by-bar (weighted) percentage. High volatility.
- SMA of Prevalence (Teal/Orange Line): The smoothed trend of the "win rate." This is your primary directional bias.
- Smoothed Quantile (Purple Line): The "rarity" of the current movement. Use this to identify exhaustion points (extremes) or breakout confirmation.
Multi-Timeframe Strategy: Micro Signals vs. Macro Context
To get the most out of SDI-P, it should be viewed as a fractal tool. The "prevalence" of demand on a Weekly chart means something very different than on a daily chart.
1. Finer Timescales (Daily / Intraday): The Early Warning System
Use lower timeframes to spot **incipient trend shifts** before they are obvious in the price structure.
Furthermore, consider the behavior of SDI-P in conjunction with price trajectory for detecting. This is often effective for detecting divergences before price trajectory shifts. For example: If price is continuing trending higher, but SDI-P is declining and making lower highs, it is a strong indicator of buyers' exhaustion and a warning of an upcoming price decline.
2. Coarser Timescales (Weekly / Monthly): The Strategic Anchor
Higher timeframes provide the structural context and serve to confirm durability of longer-term trends.
- Confirming Durable Changes: For example, a "durable" trend change is confirmed when the Weekly SDI-P crosses the 50-median and holds. This filters out the "noise" of daily volatility and identifies shifts in institutional commitment.
Note di rilascio
This update deprecates the (optional) SDI weighting in favor of (still optional) True Range based weighting.SDI weighting could severely underestimate the degree of sell (supply) and buy (demand) pressure exerted within a bar. Under SDI weighting, a bar with a larger true range could end up with a smaller relative weight in the indicator than a bar with a significantly smaller true range but larger absolute difference between supply and demand pressure.
With the new true range weighting, bars with higher intra-bar volatility will receive larger relative weighting in the indicator. This makes the indicator (at times much) more representative of the true supply-demand dynamic across bars.
Script open-source
Nello spirito di TradingView, l'autore di questo script lo ha reso open source, in modo che i trader possano esaminarne e verificarne la funzionalità. Complimenti all'autore! Sebbene sia possibile utilizzarlo gratuitamente, ricordiamo che la ripubblicazione del codice è soggetta al nostro Regolamento.

Declinazione di responsabilità
Le informazioni e le pubblicazioni non sono intese come, e non costituiscono, consulenza o raccomandazioni finanziarie, di investimento, di trading o di altro tipo fornite o approvate da TradingView. Per ulteriori informazioni, consultare i Termini di utilizzo.
Script open-source
Nello spirito di TradingView, l'autore di questo script lo ha reso open source, in modo che i trader possano esaminarne e verificarne la funzionalità. Complimenti all'autore! Sebbene sia possibile utilizzarlo gratuitamente, ricordiamo che la ripubblicazione del codice è soggetta al nostro Regolamento.
Declinazione di responsabilità
Le informazioni e le pubblicazioni non sono intese come, e non costituiscono, consulenza o raccomandazioni finanziarie, di investimento, di trading o di altro tipo fornite o approvate da TradingView. Per ulteriori informazioni, consultare i Termini di utilizzo.