OPEN-SOURCE SCRIPT
Regime Classifier [JOAT]
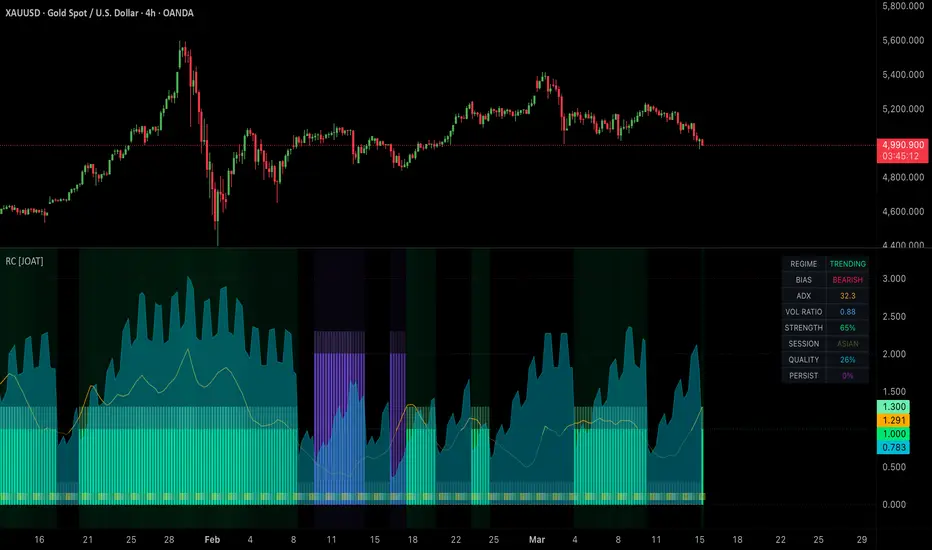
Regime Classifier
Introduction
The Regime Classifier is a sophisticated market state detection system designed to identify and classify market conditions into distinct operational regimes. Understanding the current market regime is perhaps the most critical factor in successful trading - a strategy that works beautifully in a trending market will fail miserably in a ranging market, and vice versa. This indicator solves that fundamental problem by providing clear, actionable classification of market states, allowing traders to adapt their approach to current conditions.
This tool is built for traders who understand that markets are not random but move through distinct phases, each requiring different strategies and risk management approaches. Whether you're a systematic trader needing regime filters, a discretionary trader seeking market context, or a portfolio manager adjusting exposure, this classifier provides the institutional-grade market intelligence needed to navigate any market environment successfully.

Why This Indicator Exists
Most traders apply the same strategy regardless of market conditions, then wonder why their performance is inconsistent. This indicator addresses that critical flaw by:
The classifier transforms the complex, often subjective process of market analysis into an objective, systematic framework that can be consistently applied across all instruments and timeframes.
Core Components Explained
1. ADX-Based Trend Detection
The Average Directional Index (ADX) is the primary tool for trend detection:
Pine Script®
ADX components:
ADX above 25 indicates a trending market, while below 25 suggests ranging or volatile conditions.
2. ATR-Based Volatility Analysis
The Average True Range (ATR) measures volatility and helps distinguish between different non-trending states:
Pine Script®
ATR components:
ATR analysis helps distinguish between ranging (low volatility) and volatile (high volatility) markets when ADX is below the trend threshold.
3. Regime Classification Logic
The indicator classifies markets into four distinct regimes:
Pine Script®
Regime types:
Each regime has distinct characteristics that require different trading approaches.
4. Regime Strength Measurement
Not all regimes are created equal - some are stronger and more reliable than others:
Pine Script®
Strength interpretation:
Higher strength values indicate more reliable regime classification.
5. Regime Persistence Analysis
The duration of a regime provides additional context about its reliability:
Pine Script®
Persistence features:
Long-lasting regimes are more reliable than newly formed ones.
6. Regime Quality Assessment
Quality evaluates how well the current market fits the regime characteristics:
Pine Script®
Quality components:
High quality scores indicate clear, unambiguous market conditions.
7. Session Context Integration
Market behavior varies significantly across trading sessions:
Pine Script®
Session features:
Session context helps interpret regime changes and anticipate behavior.

Visual Elements
The dashboard displays:
1. Current market regime and confidence
2. Regime strength and persistence
3. Quality score and trend direction
4. Session context and behavior
5. Regime history and transitions
6. Recommended strategies for current regime
7. Risk management adjustments
8. Regime forecast based on patterns
Input Parameters
ADX Settings:
ATR Settings:
Analysis Settings:
Visual Settings:
How to Use This Indicator
Step 1: Identify Current Regime
Check the dashboard for the current market regime. Each regime requires a different approach:
Step 2: Assess Regime Strength
Higher strength indicates more reliable conditions. In strong regimes (80%+), you can be more aggressive with position sizing. In weak regimes (<50%), reduce exposure and wait for confirmation.
Step 3: Monitor Persistence
Newly formed regimes (<10 bars) may be false signals. Mature regimes (>20 bars) are more established and reliable. Consider regime persistence in your strategy selection.
Step 4: Evaluate Quality
High quality scores (>75%) indicate clear market conditions. Low quality scores (<50%) suggest ambiguity - reduce trading or wait for clarity.
Step 5: Consider Session Context
Regimes that persist across multiple sessions are more significant. Regime changes at session opens often set the tone for the session.
Step 6: Watch for Transitions
Regime transitions signal strategy changes. A shift from trending to ranging requires switching from trend-following to range-bound strategies.
Best Practices
Strategy Applications by Regime
Trending Regime:
Ranging Regime:
Volatile Regime:
Neutral Regime:
Technical Implementation
Built with Pine Script v6 featuring:
The code uses confirmed bars for all calculations to prevent repainting and ensure reliable regime classification.
Originality Statement
This indicator is original in its comprehensive approach to regime classification and market state analysis. While ADX and ATR are established tools, this indicator is justified because:
The indicator's value lies in transforming the abstract concept of "market conditions" into concrete, actionable classifications that traders can use to adapt their strategies systematically and consistently.
Disclaimer
This indicator is provided for educational and informational purposes only. It is not financial advice or a recommendation to buy or sell any financial instrument. Regime classification is a tool for understanding market conditions, not a prediction system.
Market regimes can change suddenly due to news events, economic data, or changes in market structure. Past regime behavior does not guarantee future patterns. The indicator's classifications are mathematical calculations based on historical patterns and should be used in conjunction with other forms of analysis.
Always use proper risk management, including stop losses and position sizing appropriate for current market conditions. Different regimes require different risk approaches - volatile regimes may require smaller positions and wider stops.
The author is not responsible for any losses incurred from using this indicator. Users assume full responsibility for all trading decisions made using this system.
-Made with passion by officialjackofalltrades
Introduction
The Regime Classifier is a sophisticated market state detection system designed to identify and classify market conditions into distinct operational regimes. Understanding the current market regime is perhaps the most critical factor in successful trading - a strategy that works beautifully in a trending market will fail miserably in a ranging market, and vice versa. This indicator solves that fundamental problem by providing clear, actionable classification of market states, allowing traders to adapt their approach to current conditions.
This tool is built for traders who understand that markets are not random but move through distinct phases, each requiring different strategies and risk management approaches. Whether you're a systematic trader needing regime filters, a discretionary trader seeking market context, or a portfolio manager adjusting exposure, this classifier provides the institutional-grade market intelligence needed to navigate any market environment successfully.
Why This Indicator Exists
Most traders apply the same strategy regardless of market conditions, then wonder why their performance is inconsistent. This indicator addresses that critical flaw by:
- Regime Classification: Identifies four distinct market states with clear characteristics
- Regime Strength: Measures how strongly the market exhibits regime characteristics
- Regime Persistence: Tracks how long the current regime has been in place
- Regime Quality: Evaluates the reliability of the current regime classification
- Session Awareness: Considers session context for regime analysis
- Regime Transitions: Detects and signals regime changes for strategy adaptation
The classifier transforms the complex, often subjective process of market analysis into an objective, systematic framework that can be consistently applied across all instruments and timeframes.
Core Components Explained
1. ADX-Based Trend Detection
The Average Directional Index (ADX) is the primary tool for trend detection:
ADX components:
- ADX Value: Trend strength (0-100), regardless of direction
- +DI: Bullish directional movement
- -DI: Bearish directional movement
- Trend Threshold: Minimum ADX for trend classification (default 25)
- Directional Bias: +DI vs -DI for trend direction
ADX above 25 indicates a trending market, while below 25 suggests ranging or volatile conditions.
2. ATR-Based Volatility Analysis
The Average True Range (ATR) measures volatility and helps distinguish between different non-trending states:
ATR components:
- Current ATR: Recent volatility measurement
- Average ATR: Long-term volatility baseline
- ATR Ratio: Current volatility relative to average
- Expansion Threshold: Ratio indicating high volatility (default 1.4)
- Contraction Threshold: Ratio indicating low volatility (default 0.6)
ATR analysis helps distinguish between ranging (low volatility) and volatile (high volatility) markets when ADX is below the trend threshold.
3. Regime Classification Logic
The indicator classifies markets into four distinct regimes:
Regime types:
- Trending (ADX ≥ 25): Strong directional movement with clear trend
- Ranging (ADX < 25, ATR ratio ≤ 0.6): Low volatility, sideways movement
- Volatile (ADX < 25, ATR ratio ≥ 1.4): High volatility, erratic movement
- Neutral (ADX < 25, 0.6 < ATR ratio < 1.4): Transition between defined states
Each regime has distinct characteristics that require different trading approaches.
4. Regime Strength Measurement
Not all regimes are created equal - some are stronger and more reliable than others:
Strength interpretation:
- Trending Strength: Based on ADX value (higher ADX = stronger trend)
- Ranging Strength: Based on how low volatility is (lower ATR = stronger range)
- Volatile Strength: Based on how high volatility is (higher ATR = stronger volatility)
- Neutral Strength: Fixed at 50% as baseline
- Strength Range: 0-100% indicating regime confidence
Higher strength values indicate more reliable regime classification.
5. Regime Persistence Analysis
The duration of a regime provides additional context about its reliability:
Persistence features:
- Regime Bars: Number of consecutive bars in current regime
- Regime Start: When the current regime began
- Persistence Score: Normalized duration (0-100%)
- Lookback Period: Reference period for normalization (default 50)
- Mature Regimes: Higher persistence indicates established conditions
Long-lasting regimes are more reliable than newly formed ones.
6. Regime Quality Assessment
Quality evaluates how well the current market fits the regime characteristics:
Quality components:
- ADX Quality: How well trend strength matches regime expectations
- ATR Quality: How well volatility matches regime expectations
- Quality Score: Combined assessment (0-100%)
- High Quality: Clear regime characteristics
- Low Quality: Ambiguous or transitioning conditions
High quality scores indicate clear, unambiguous market conditions.
7. Session Context Integration
Market behavior varies significantly across trading sessions:
Session features:
- Session Detection: Identifies major trading sessions
- Session Multipliers: Adjusts expectations based on session characteristics
- Session Persistence: Tracks regime duration within current session
- Session Quality: Evaluates regime quality within session context
- Session Transitions: Identifies regime changes at session opens/closes
Session context helps interpret regime changes and anticipate behavior.
Visual Elements
- Regime Histogram: Color-coded bars showing current regime
- Strength Meter: Visual representation of regime strength
- Persistence Line: Shows regime duration over time
- Quality Gauge: Quality score visualization
- Background Colors: Regime-based background shading
- Session Markers: Visual session boundaries
- Dashboard: Real-time regime metrics
- Transition Alerts: Visual regime change notifications
The dashboard displays:
1. Current market regime and confidence
2. Regime strength and persistence
3. Quality score and trend direction
4. Session context and behavior
5. Regime history and transitions
6. Recommended strategies for current regime
7. Risk management adjustments
8. Regime forecast based on patterns
Input Parameters
ADX Settings:
- ADX Period: Trend strength calculation (default: 14)
- Trend Threshold: Minimum ADX for trend regime (default: 25)
- ADX Smoothing: Additional smoothing for ADX (default: 3)
ATR Settings:
- ATR Period: Volatility calculation (default: 14)
- Expansion Multiplier: High volatility threshold (default: 1.4)
- Contraction Multiplier: Low volatility threshold (default: 0.6)
Analysis Settings:
- Persistence Lookback: Reference for persistence score (default: 50)
- Quality Smoothing: Smoothing for quality calculation (default: 5)
- Session Awareness: Enable session analysis (default: true)
Visual Settings:
- Color Scheme: Customizable regime colors
- Background Shading: Enable regime backgrounds
- Dashboard Display: Show metrics panel
- Alert Settings: Configure regime change alerts
How to Use This Indicator
Step 1: Identify Current Regime
Check the dashboard for the current market regime. Each regime requires a different approach:
- Trending: Use trend-following strategies, let winners run
- Ranging: Use mean-reversion strategies, take profits at levels
- Volatile: Reduce position size, use wider stops, or avoid trading
- Neutral: Wait for clarity, reduce trading activity
Step 2: Assess Regime Strength
Higher strength indicates more reliable conditions. In strong regimes (80%+), you can be more aggressive with position sizing. In weak regimes (<50%), reduce exposure and wait for confirmation.
Step 3: Monitor Persistence
Newly formed regimes (<10 bars) may be false signals. Mature regimes (>20 bars) are more established and reliable. Consider regime persistence in your strategy selection.
Step 4: Evaluate Quality
High quality scores (>75%) indicate clear market conditions. Low quality scores (<50%) suggest ambiguity - reduce trading or wait for clarity.
Step 5: Consider Session Context
Regimes that persist across multiple sessions are more significant. Regime changes at session opens often set the tone for the session.
Step 6: Watch for Transitions
Regime transitions signal strategy changes. A shift from trending to ranging requires switching from trend-following to range-bound strategies.
Best Practices
- Always adapt your strategy to the current regime - don't use a trending strategy in ranging markets
- High strength + high quality = maximum confidence in regime classification
- Low persistence regimes (<10 bars) may be false - wait for confirmation
- Session transitions often trigger regime changes - be alert at session opens
- Volatile regimes are dangerous for most traders - consider reducing activity
- Regime persistence is key - the longer a regime persists, the more reliable it is
- Quality scores below 50% suggest waiting for clarity
- Combine regime analysis with your existing strategy for better results
- Keep a regime journal to track how each instrument behaves in different regimes
- Use regime transitions as signals to adjust your entire trading approach
Strategy Applications by Regime
Trending Regime:
- Trend-following strategies (moving averages, ADX, momentum)
- Let winners run to maximum targets
- Use trailing stops to capture extended moves
- Add to positions on pullbacks in trend direction
- Higher position sizing due to clear direction
Ranging Regime:
- Mean-reversion strategies (RSI, Stochastic, Bollinger Bands)
- Take profits at support/resistance levels
- Use fixed targets - don't let winners turn into losers
- Fade extreme moves toward the range middle
- Smaller position sizing due to limited moves
Volatile Regime:
- Reduce position size significantly (50% or less)
- Use wider stops to avoid premature exits
- Consider sitting out until conditions improve
- Focus on volatility breakout patterns if trading
- Quick profit taking - volatile conditions reverse quickly
Neutral Regime:
- Wait for clarity before taking new positions
- Manage existing positions more actively
- Reduce trading frequency
- Look for regime transition signals
- Focus on longer timeframe analysis for direction
Technical Implementation
Built with Pine Script v6 featuring:
- Advanced ADX calculation with directional movement analysis
- Multi-timeframe ATR analysis for volatility assessment
- Regime classification with confirmation logic
- Strength, persistence, and quality scoring systems
- Session awareness with timezone handling
- Comprehensive visualization with multiple display modes
- Real-time dashboard with 10 key metrics
- Alert conditions for regime changes and thresholds
- Export functions for strategy integration
- Historical regime tracking and pattern recognition
The code uses confirmed bars for all calculations to prevent repainting and ensure reliable regime classification.
Originality Statement
This indicator is original in its comprehensive approach to regime classification and market state analysis. While ADX and ATR are established tools, this indicator is justified because:
- It synthesizes trend and volatility analysis into a unified regime classification system
- The strength, persistence, and quality scoring provides multi-dimensional regime assessment
- Session awareness adds critical context often missing from regime analysis
- Regime transition detection helps traders adapt strategy changes proactively
- The four-regime classification (Trending, Ranging, Volatile, Neutral) covers all market states
- Quality assessment helps distinguish between clear and ambiguous market conditions
- Persistence analysis identifies mature, reliable regimes versus new, potentially false ones
- Comprehensive visualization makes complex regime analysis accessible and actionable
- Export functions enable regime-based strategy filtering and adaptation
- Each component provides unique insights: ADX shows trend, ATR shows volatility, strength shows conviction, persistence shows duration, and quality shows clarity
The indicator's value lies in transforming the abstract concept of "market conditions" into concrete, actionable classifications that traders can use to adapt their strategies systematically and consistently.
Disclaimer
This indicator is provided for educational and informational purposes only. It is not financial advice or a recommendation to buy or sell any financial instrument. Regime classification is a tool for understanding market conditions, not a prediction system.
Market regimes can change suddenly due to news events, economic data, or changes in market structure. Past regime behavior does not guarantee future patterns. The indicator's classifications are mathematical calculations based on historical patterns and should be used in conjunction with other forms of analysis.
Always use proper risk management, including stop losses and position sizing appropriate for current market conditions. Different regimes require different risk approaches - volatile regimes may require smaller positions and wider stops.
The author is not responsible for any losses incurred from using this indicator. Users assume full responsibility for all trading decisions made using this system.
-Made with passion by officialjackofalltrades
Script open-source
Nello spirito di TradingView, l'autore di questo script lo ha reso open source, in modo che i trader possano esaminarne e verificarne la funzionalità. Complimenti all'autore! Sebbene sia possibile utilizzarlo gratuitamente, ricordiamo che la ripubblicazione del codice è soggetta al nostro Regolamento.

The Institutional Grade Trading Ecosystem, Built to win trades 📈
Get Access 👇
jackofalltrades.vip 🌐
t.me/jackofalltradesvip 🃏
Get Access 👇
jackofalltrades.vip 🌐
t.me/jackofalltradesvip 🃏
Declinazione di responsabilità
Le informazioni e le pubblicazioni non sono intese come, e non costituiscono, consulenza o raccomandazioni finanziarie, di investimento, di trading o di altro tipo fornite o approvate da TradingView. Per ulteriori informazioni, consultare i Termini di utilizzo.
Script open-source
Nello spirito di TradingView, l'autore di questo script lo ha reso open source, in modo che i trader possano esaminarne e verificarne la funzionalità. Complimenti all'autore! Sebbene sia possibile utilizzarlo gratuitamente, ricordiamo che la ripubblicazione del codice è soggetta al nostro Regolamento.
The Institutional Grade Trading Ecosystem, Built to win trades 📈
Get Access 👇
jackofalltrades.vip 🌐
t.me/jackofalltradesvip 🃏
Get Access 👇
jackofalltrades.vip 🌐
t.me/jackofalltradesvip 🃏
Declinazione di responsabilità
Le informazioni e le pubblicazioni non sono intese come, e non costituiscono, consulenza o raccomandazioni finanziarie, di investimento, di trading o di altro tipo fornite o approvate da TradingView. Per ulteriori informazioni, consultare i Termini di utilizzo.