OPEN-SOURCE SCRIPT
Smart StochRSI Divergence Oscillator with GAPS & HEAT [Zofesu]
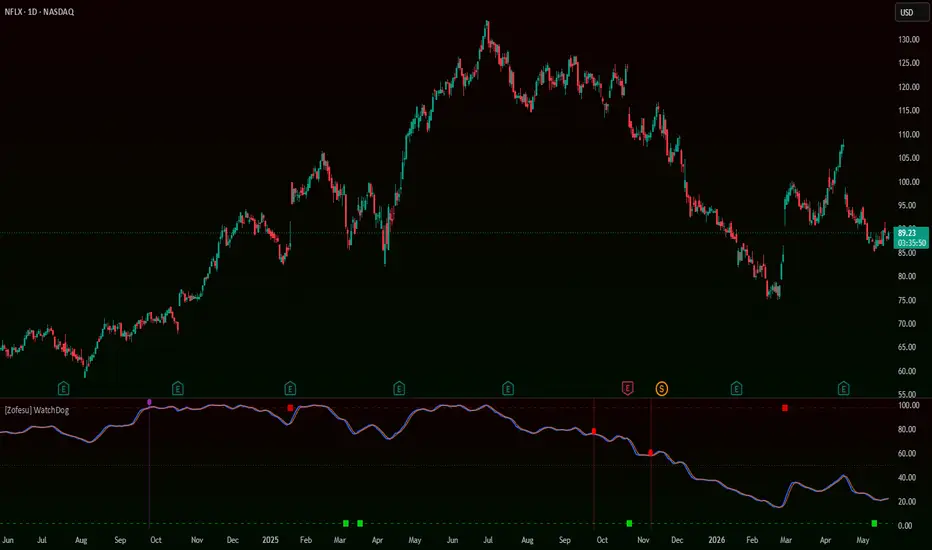
Smart StochRSI Divergence Oscillator with GAPS & HEAT [Zofesu] is a momentum oscillator built on Stochastic RSI extended with three original signal layers not present in standard StochRSI implementations: a classical divergence engine with institutional volume confirmation, a gap return detection system, and a Heat signal that identifies parabolic price extensions from oscillator extremes.
Each layer operates independently and addresses a different market condition — divergence captures momentum exhaustion at extremes, gap return tracks liquidity rebalancing, and Heat identifies the continuation phase of parabolic moves. Seven alert conditions cover all signal types individually and as a combined trigger.
─────────────────────────────────────
01 — What is WatchDog?
─────────────────────────────────────
WatchDog monitors the Stochastic RSI oscillator across three behavioral states and generates signals only when precise conditions align — oscillator position, K/D crossover direction, price confirmation, and volume participation.
The base oscillator uses a long lookback period (default 700 bars for both RSI and Stochastic) to produce a stable, low-noise read of momentum across the full market cycle. This is intentional — short lookbacks produce too many false extremes. At 700 bars the oscillator reaches its upper and lower extremes only during genuine momentum events.
─────────────────────────────────────
02 — Classical Divergence Signals
─────────────────────────────────────
The classical signal engine uses a state machine with three phases:
Phase 1 — Extreme entry
K rises above the upper extreme (default 98) → mode set to BEAR watch. Price at that moment is stored as the reference level.
K falls below the lower extreme (default 2) → mode set to BULL watch. Price stored.
Phase 2 — Return through midpoint
K must cross back through the midpoint (default 50) before a signal can fire. This prevents premature signals while the oscillator is still deep in the extreme zone.
Phase 3 — Signal confirmation
Bear signal: K crosses under D while between upper extreme and midpoint, AND current price is higher than the stored reference price (price divergence) AND volume is above the selected percentile.
Bull signal: K crosses over D while between lower extreme and midpoint, AND current price is lower than the stored reference price AND volume is above the selected percentile.
This three-phase structure ensures classical signals represent genuine momentum divergence — price making a higher high while K crosses down from an extreme is the textbook definition of bearish hidden divergence with volume confirmation.
─────────────────────────────────────
03 — Institutional Volume Filter
─────────────────────────────────────
Classical signals require volume to exceed a minimum percentile rank (default 25th percentile over 500 bars). This means current volume must be in the top 75% of recent volume — filtering out low-conviction crossovers that occur on thin trading days.
When the filter is disabled, all K/D crossovers meeting the price and oscillator conditions will signal regardless of volume.
─────────────────────────────────────
04 — Gap Return Signals
─────────────────────────────────────
Price gaps represent unfilled liquidity — areas where no trading occurred and orders were left unmatched. Institutional algorithms often return to fill these gaps before continuing the move.
WatchDog detects gaps by comparing the current candle's range to the 14-bar average range. A gap is registered when the distance between the previous candle's high and current candle's low (bull gap) or previous candle's low and current candle's high (bear gap) exceeds the average range by the configured minimum deviation percentage (default 30%).
Once a gap is registered, the indicator monitors for price returning to the gap boundary:
Bull Gap Return (green square) — price returned to fill a bullish gap below. Potential support reaction zone.
Bear Gap Return (red square) — price returned to fill a bearish gap above. Potential resistance reaction zone.
The gap level is cleared after being filled — each gap is tracked once.
─────────────────────────────────────
05 — Heat Signals
─────────────────────────────────────
In equities and high-momentum assets, significant percentage moves from a prior extreme often attract additional momentum capital — amplifying the move further before exhaustion sets in. Strong price action tends to generate more strong price action in the short term as trend-followers and algorithms pile in.
The Heat signal is designed to detect this pattern. While K is at or above the upper extreme, the indicator tracks the price level at each new extreme touch. If price subsequently moves more than the configured percentage (default 15%) above that reference level while K remains in the extreme zone, a Heat Bearish signal fires — marking a potential parabolic overheating condition.
Heat Bullish fires symmetrically when K is at the lower extreme and price drops more than 15% below the reference level.
Heat Bearish (purple label down) — price has moved significantly higher while oscillator stays overbought. Parabolic extension, potential exhaustion ahead.
Heat Bullish (purple label up) — price has dropped significantly while oscillator stays oversold. Panic extension, potential exhaustion ahead.
Purple background highlights Heat signal bars for immediate visibility.
─────────────────────────────────────
06 — Settings
─────────────────────────────────────
Calculation
Stochastic Length — lookback for StochRSI. Default: 700.
RSI Length — lookback for base RSI. Default: 700.
K Smoothing — SMA period for K line. Default: 5.
D Smoothing — SMA period for D line. Default: 3.
Volume Settings
Use Institutional Volume Filter — enable/disable volume gate for classical signals.
Target Volume Percentile — minimum volume rank required. Default: 25.
Volume Lookback Period — bars for percentile calculation. Default: 500.
Gap Settings
Gap Minimal Deviation % — minimum gap size as % of 14-bar average range. Default: 30%.
Heat Signal Settings
Heat Signal Distance % — minimum % move from last extreme to trigger Heat. Default: 15%.
Show Heat Breakout Signals — enable/disable Heat signals.
Levels
Upper Extreme Level — overbought threshold. Default: 98.
Mid Level — midpoint reference. Default: 50.
Lower Extreme Level — oversold threshold. Default: 2.
─────────────────────────────────────
07 — How To Use
─────────────────────────────────────
Step 1 — Watch for K to reach an extreme
Upper extreme (98) = overbought state entered. Lower extreme (2) = oversold state entered. The oscillator must reach these levels for any classical or Heat signal to become possible.
Step 2 — Wait for the classical signal
Red label = bearish divergence confirmed with volume. K crossed under D returning from overbought, price made a higher high. Enter short on next bar, SL above recent swing high.
Green label = bullish divergence confirmed with volume. K crossed over D returning from oversold, price made a lower low. Enter long on next bar, SL below recent swing low.
Step 3 — Monitor Heat signals
Purple label = parabolic extension detected. On equities this can mark either a continuation entry for momentum traders or an exhaustion warning for counter-trend traders. Context matters — use with higher timeframe bias.
Step 4 — Use Gap Return squares as context
Green square = liquidity below was rebalanced. Watch for support reaction.
Red square = liquidity above was rebalanced. Watch for resistance reaction.
Step 5 — Alerts
Seven alert conditions are pre-configured:
Bearish Divergence / Bullish Divergence
Extreme HEAT Bearish / Extreme HEAT Bullish
Gap Fill Bullish / Gap Fill Bearish
Any Zofesu Signal — combined trigger for all events
Works on all asset classes: Indices, Forex, Gold, Oil, Crypto, Stocks.
Best timeframes: H4, D1, W1
Each layer operates independently and addresses a different market condition — divergence captures momentum exhaustion at extremes, gap return tracks liquidity rebalancing, and Heat identifies the continuation phase of parabolic moves. Seven alert conditions cover all signal types individually and as a combined trigger.
─────────────────────────────────────
01 — What is WatchDog?
─────────────────────────────────────
WatchDog monitors the Stochastic RSI oscillator across three behavioral states and generates signals only when precise conditions align — oscillator position, K/D crossover direction, price confirmation, and volume participation.
The base oscillator uses a long lookback period (default 700 bars for both RSI and Stochastic) to produce a stable, low-noise read of momentum across the full market cycle. This is intentional — short lookbacks produce too many false extremes. At 700 bars the oscillator reaches its upper and lower extremes only during genuine momentum events.
─────────────────────────────────────
02 — Classical Divergence Signals
─────────────────────────────────────
The classical signal engine uses a state machine with three phases:
Phase 1 — Extreme entry
K rises above the upper extreme (default 98) → mode set to BEAR watch. Price at that moment is stored as the reference level.
K falls below the lower extreme (default 2) → mode set to BULL watch. Price stored.
Phase 2 — Return through midpoint
K must cross back through the midpoint (default 50) before a signal can fire. This prevents premature signals while the oscillator is still deep in the extreme zone.
Phase 3 — Signal confirmation
Bear signal: K crosses under D while between upper extreme and midpoint, AND current price is higher than the stored reference price (price divergence) AND volume is above the selected percentile.
Bull signal: K crosses over D while between lower extreme and midpoint, AND current price is lower than the stored reference price AND volume is above the selected percentile.
This three-phase structure ensures classical signals represent genuine momentum divergence — price making a higher high while K crosses down from an extreme is the textbook definition of bearish hidden divergence with volume confirmation.
─────────────────────────────────────
03 — Institutional Volume Filter
─────────────────────────────────────
Classical signals require volume to exceed a minimum percentile rank (default 25th percentile over 500 bars). This means current volume must be in the top 75% of recent volume — filtering out low-conviction crossovers that occur on thin trading days.
When the filter is disabled, all K/D crossovers meeting the price and oscillator conditions will signal regardless of volume.
─────────────────────────────────────
04 — Gap Return Signals
─────────────────────────────────────
Price gaps represent unfilled liquidity — areas where no trading occurred and orders were left unmatched. Institutional algorithms often return to fill these gaps before continuing the move.
WatchDog detects gaps by comparing the current candle's range to the 14-bar average range. A gap is registered when the distance between the previous candle's high and current candle's low (bull gap) or previous candle's low and current candle's high (bear gap) exceeds the average range by the configured minimum deviation percentage (default 30%).
Once a gap is registered, the indicator monitors for price returning to the gap boundary:
Bull Gap Return (green square) — price returned to fill a bullish gap below. Potential support reaction zone.
Bear Gap Return (red square) — price returned to fill a bearish gap above. Potential resistance reaction zone.
The gap level is cleared after being filled — each gap is tracked once.
─────────────────────────────────────
05 — Heat Signals
─────────────────────────────────────
In equities and high-momentum assets, significant percentage moves from a prior extreme often attract additional momentum capital — amplifying the move further before exhaustion sets in. Strong price action tends to generate more strong price action in the short term as trend-followers and algorithms pile in.
The Heat signal is designed to detect this pattern. While K is at or above the upper extreme, the indicator tracks the price level at each new extreme touch. If price subsequently moves more than the configured percentage (default 15%) above that reference level while K remains in the extreme zone, a Heat Bearish signal fires — marking a potential parabolic overheating condition.
Heat Bullish fires symmetrically when K is at the lower extreme and price drops more than 15% below the reference level.
Heat Bearish (purple label down) — price has moved significantly higher while oscillator stays overbought. Parabolic extension, potential exhaustion ahead.
Heat Bullish (purple label up) — price has dropped significantly while oscillator stays oversold. Panic extension, potential exhaustion ahead.
Purple background highlights Heat signal bars for immediate visibility.
─────────────────────────────────────
06 — Settings
─────────────────────────────────────
Calculation
Stochastic Length — lookback for StochRSI. Default: 700.
RSI Length — lookback for base RSI. Default: 700.
K Smoothing — SMA period for K line. Default: 5.
D Smoothing — SMA period for D line. Default: 3.
Volume Settings
Use Institutional Volume Filter — enable/disable volume gate for classical signals.
Target Volume Percentile — minimum volume rank required. Default: 25.
Volume Lookback Period — bars for percentile calculation. Default: 500.
Gap Settings
Gap Minimal Deviation % — minimum gap size as % of 14-bar average range. Default: 30%.
Heat Signal Settings
Heat Signal Distance % — minimum % move from last extreme to trigger Heat. Default: 15%.
Show Heat Breakout Signals — enable/disable Heat signals.
Levels
Upper Extreme Level — overbought threshold. Default: 98.
Mid Level — midpoint reference. Default: 50.
Lower Extreme Level — oversold threshold. Default: 2.
─────────────────────────────────────
07 — How To Use
─────────────────────────────────────
Step 1 — Watch for K to reach an extreme
Upper extreme (98) = overbought state entered. Lower extreme (2) = oversold state entered. The oscillator must reach these levels for any classical or Heat signal to become possible.
Step 2 — Wait for the classical signal
Red label = bearish divergence confirmed with volume. K crossed under D returning from overbought, price made a higher high. Enter short on next bar, SL above recent swing high.
Green label = bullish divergence confirmed with volume. K crossed over D returning from oversold, price made a lower low. Enter long on next bar, SL below recent swing low.
Step 3 — Monitor Heat signals
Purple label = parabolic extension detected. On equities this can mark either a continuation entry for momentum traders or an exhaustion warning for counter-trend traders. Context matters — use with higher timeframe bias.
Step 4 — Use Gap Return squares as context
Green square = liquidity below was rebalanced. Watch for support reaction.
Red square = liquidity above was rebalanced. Watch for resistance reaction.
Step 5 — Alerts
Seven alert conditions are pre-configured:
Bearish Divergence / Bullish Divergence
Extreme HEAT Bearish / Extreme HEAT Bullish
Gap Fill Bullish / Gap Fill Bearish
Any Zofesu Signal — combined trigger for all events
Works on all asset classes: Indices, Forex, Gold, Oil, Crypto, Stocks.
Best timeframes: H4, D1, W1
Script open-source
Nello spirito di TradingView, l'autore di questo script lo ha reso open source, in modo che i trader possano esaminarne e verificarne la funzionalità. Complimenti all'autore! Sebbene sia possibile utilizzarlo gratuitamente, ricordiamo che la ripubblicazione del codice è soggetta al nostro Regolamento.

Think Act Believe. Use SL. Use BreakEven. Respect the market. Your ego and arrogance can destroy your trading account. Never leave the table unless you have a closed trade or SL/BE. Indicator does not guarantee profit.
discord.gg/FcSJpSvNnv
discord.gg/FcSJpSvNnv
Declinazione di responsabilità
Le informazioni e le pubblicazioni non sono intese come, e non costituiscono, consulenza o raccomandazioni finanziarie, di investimento, di trading o di altro tipo fornite o approvate da TradingView. Per ulteriori informazioni, consultare i Termini di utilizzo.
Script open-source
Nello spirito di TradingView, l'autore di questo script lo ha reso open source, in modo che i trader possano esaminarne e verificarne la funzionalità. Complimenti all'autore! Sebbene sia possibile utilizzarlo gratuitamente, ricordiamo che la ripubblicazione del codice è soggetta al nostro Regolamento.
Think Act Believe. Use SL. Use BreakEven. Respect the market. Your ego and arrogance can destroy your trading account. Never leave the table unless you have a closed trade or SL/BE. Indicator does not guarantee profit.
discord.gg/FcSJpSvNnv
discord.gg/FcSJpSvNnv
Declinazione di responsabilità
Le informazioni e le pubblicazioni non sono intese come, e non costituiscono, consulenza o raccomandazioni finanziarie, di investimento, di trading o di altro tipo fornite o approvate da TradingView. Per ulteriori informazioni, consultare i Termini di utilizzo.