OPEN-SOURCE SCRIPT
Aggiornato Expected Move Bands
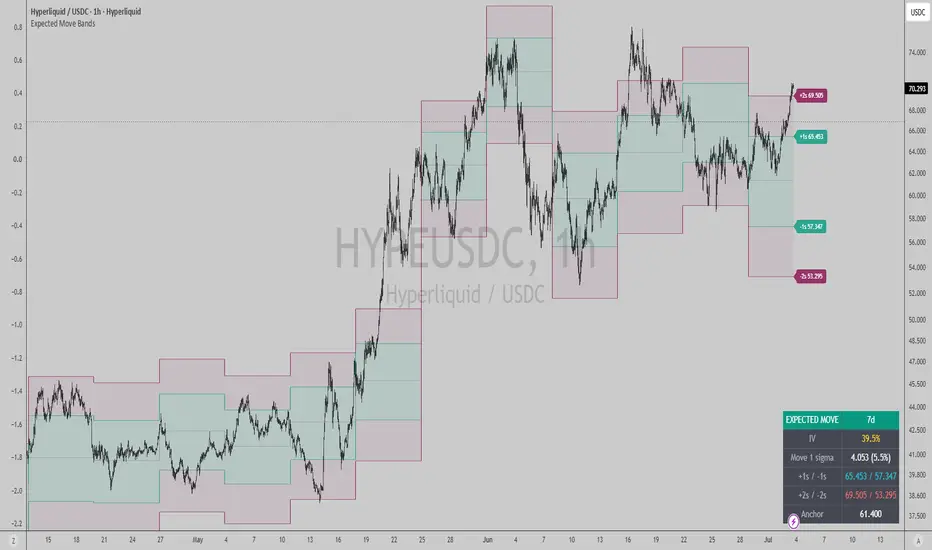
Every options desk opens the week with the same question: how far is this thing supposed to travel by Friday? The answer's already priced. Implied vol is the market's own estimate of the coming move, and you can read it straight off the chart instead of running the math in your head.
This draws that estimate as bands around price. It anchors to the open of each week (or month, your call) and holds the bands flat across the period, the way a desk marks its expected range Monday morning and watches price work inside it.
The teal band is one standard deviation. If the market's vol read is right, price closes inside it about two times out of three. The wider band is two sigma, the tail. When price breaks the one-sigma band and holds out there, that's range expansion, the move getting repriced while it happens. Usually worth a look.
IV comes from VIX on equities and Deribit DVOL on crypto, picked automatically. If neither is on the chart it falls back to a Parkinson range estimate and tags it "(est)" so you know what you're looking at. The dashboard shows the live IV, the expected move in points and percent, and the exact levels. Labels print the prices on the chart. Alerts fire when price closes outside one sigma or tags two.
I trade options and size around the implied move all the time. Am I selling the edge of the band or inside it, is price respecting the range or busting it. That read comes first. Selling a strike outside the expected move is a different bet than selling one inside it, and most people never check.
Expected Move Bands tell you the range the market is pricing. My Vol Premium Gauge tells you whether you're paid enough to sell it. Run them together.
Auto-detects crypto vs equity. Works on any timeframe at or below your anchor.
Free to use, open source. Follow for more vol and options tools.
Cheers,
Ivan Labrie.
This draws that estimate as bands around price. It anchors to the open of each week (or month, your call) and holds the bands flat across the period, the way a desk marks its expected range Monday morning and watches price work inside it.
The teal band is one standard deviation. If the market's vol read is right, price closes inside it about two times out of three. The wider band is two sigma, the tail. When price breaks the one-sigma band and holds out there, that's range expansion, the move getting repriced while it happens. Usually worth a look.
IV comes from VIX on equities and Deribit DVOL on crypto, picked automatically. If neither is on the chart it falls back to a Parkinson range estimate and tags it "(est)" so you know what you're looking at. The dashboard shows the live IV, the expected move in points and percent, and the exact levels. Labels print the prices on the chart. Alerts fire when price closes outside one sigma or tags two.
I trade options and size around the implied move all the time. Am I selling the edge of the band or inside it, is price respecting the range or busting it. That read comes first. Selling a strike outside the expected move is a different bet than selling one inside it, and most people never check.
Expected Move Bands tell you the range the market is pricing. My Vol Premium Gauge tells you whether you're paid enough to sell it. Run them together.
Auto-detects crypto vs equity. Works on any timeframe at or below your anchor.
Free to use, open source. Follow for more vol and options tools.
Cheers,
Ivan Labrie.
Note di rilascio
v1.1: Table is now movable (Display > Table position) and text size is adjustable. Default position moved to bottom right so it stays clear of the pane controls. Bumped label contrast.Script open-source
Nello spirito di TradingView, l'autore di questo script lo ha reso open source, in modo che i trader possano esaminarne e verificarne la funzionalità. Complimenti all'autore! Sebbene sia possibile utilizzarlo gratuitamente, ricordiamo che la ripubblicazione del codice è soggetta al nostro Regolamento.

Declinazione di responsabilità
Le informazioni e le pubblicazioni non sono intese come, e non costituiscono, consulenza o raccomandazioni finanziarie, di investimento, di trading o di altro tipo fornite o approvate da TradingView. Per ulteriori informazioni, consultare i Termini di utilizzo.
Script open-source
Nello spirito di TradingView, l'autore di questo script lo ha reso open source, in modo che i trader possano esaminarne e verificarne la funzionalità. Complimenti all'autore! Sebbene sia possibile utilizzarlo gratuitamente, ricordiamo che la ripubblicazione del codice è soggetta al nostro Regolamento.
Declinazione di responsabilità
Le informazioni e le pubblicazioni non sono intese come, e non costituiscono, consulenza o raccomandazioni finanziarie, di investimento, di trading o di altro tipo fornite o approvate da TradingView. Per ulteriori informazioni, consultare i Termini di utilizzo.