OPEN-SOURCE SCRIPT
Market Structure & Momentum [India Chart School]
What this does
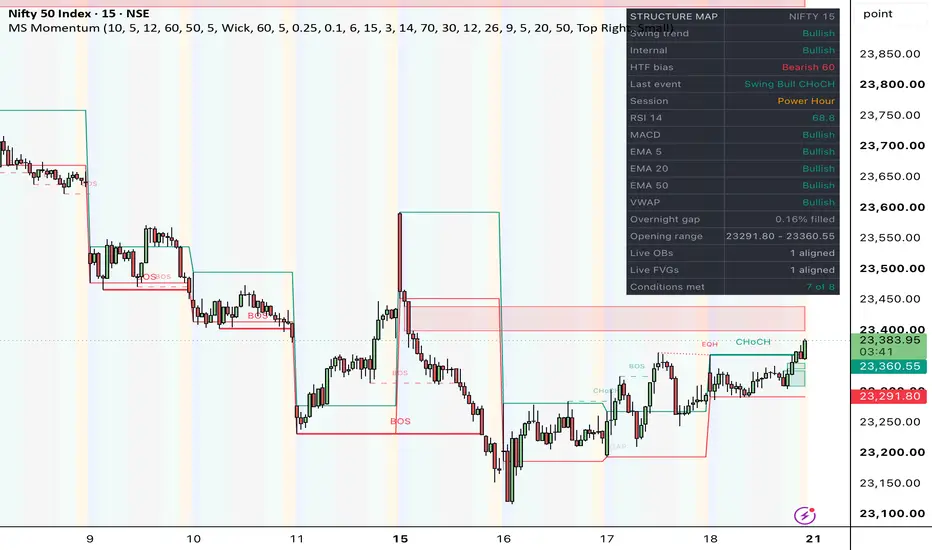
This indicator tracks the shape of price and reports whether the rest of the chart agrees with it. It finds confirmed swing highs and lows, marks the bar that closes through one of them, and names that break as either a break of structure or a change of character. Around that core it draws the zone the break originated from, shades the part of the NSE trading day you are in, and grades the break against momentum read on the same timeframe.
How the structure engine works
Swing points are confirmed pivots found with TradingView's built-in pivot functions. A pivot high is recognised only after Swing Length bars have closed beyond it, so nothing is drawn before confirmation. Two passes run at once: a major pass at Swing Length, and a minor pass at Internal Length that describes the smaller swings inside the major ones.
When price closes through a confirmed swing point, the script labels it BOS if the break continues the prevailing direction, or CHoCH if it goes against it. CHoCH is the more informative of the two, since it is the first structural sign of a turn.
Order blocks
Rather than taking the extreme candle of the displacement leg, this script walks backwards from the breakout bar to the swing point it broke and takes the most recent candle that closed against the direction of the break. That candle's full range becomes the zone. Zones are removed on invalidation, either on a wick through the level or on a close beyond it, depending on the setting.
Fair value gaps and equal highs/lows
Fair value gaps are three-candle imbalances computed on the chart timeframe, filtered by a minimum size expressed in ATR. Equal highs and lows are consecutive swing points within an ATR-scaled tolerance, joined by a dotted line.
NSE session engine
On intraday charts the background is shaded by IST clock time into six windows: pre-open 09:00–09:15, opening drive 09:15–09:45, morning trend 09:45–11:30, lunch drift 11:30–13:30, afternoon 13:30–14:30, and power hour 14:30–15:30. Most structure tools shade London and New York hours, which describe a trading day unrelated to the NSE. The opening range high and low from the first N minutes are plotted for the rest of the session, and the overnight gap between the previous close and today's open is drawn as a zone that turns grey once filled.
Why RSI, MACD and EMAs are included
These are not signal generators here. They grade structure breaks. A change of character that fires while the higher timeframe, the EMA stack and MACD all disagree is a weaker event than the same break with all three behind it. The dashboard makes that difference visible in one place instead of requiring three additional panes. RSI, MACD and the EMAs 5/20/50 are all computed on the chart timeframe.
Dashboard
A two-column panel reporting swing trend, internal trend, higher-timeframe bias, the last structure event, the current session, RSI value with overbought/oversold tags, MACD direction, whether price sits above or below each of the three EMAs, VWAP side, overnight gap status, opening range, live order block and fair value gap counts, and a confluence count.
The confluence count
The bottom row counts how many of eight conditions currently agree with the swing trend: higher-timeframe bias, internal structure, the EMA stack, RSI side of 50, MACD, VWAP side, a live order block in direction, and whether the bar falls outside the lunch-drift window. This is a count of conditions that are true at this moment. It is not a probability, a win rate, or a forecast, and it should not be read as one. A low count usually means the chart is conflicted and there is no clean read available.
Settings worth knowing
Swing Length is the main control. Raise it on noisy charts before changing anything else. Internal structure can be switched off entirely if the chart feels crowded. Session tints, the opening range and the gap box switch themselves off above intraday timeframes, so the same script works on a daily equity chart without clutter.
Limitations
Confirmed pivots are recognised late by construction. With Swing Length at 10, a swing high is confirmed ten bars after it prints. The structure line is drawn back to where the pivot actually was, which can look like hindsight but is not, since nothing is drawn before confirmation.
In ranging markets, BOS and CHoCH alternate without much meaning. The equal-high and equal-low labels are usually the more honest reading there.
VWAP requires volume. Spot indices carry no volume on most feeds, so that row reads "no volume" and the corresponding confluence condition scores zero. Use the futures chart if VWAP matters to you.
The higher-timeframe bias is offset by one bar and requested with lookahead off. This is what prevents repainting, and it means the reading updates only when the higher-timeframe bar closes. It is the only higher-timeframe request in the script; everything else is computed on the chart timeframe.
Order block definitions vary between tools. The one used here is the last opposing candle before the move. Tools that use the extreme candle of the leg will draw different zones from identical price action. Neither definition is the correct one.
Credits
The visual language of market-structure indicators on TradingView was popularised by LuxAlgo's open-source Smart Money Concepts publication, which served as the reference for how this class of tool is presented on a chart. No code from that script is reused here — the structure engine is written from scratch on TradingView's built-in pivot functions, and the order block definition differs from that publication's approach.
Published open-source under the Mozilla Public License 2.0.
This indicator is educational. It is not investment advice, not a research recommendation, and not a solicitation to buy or sell any security.
This indicator tracks the shape of price and reports whether the rest of the chart agrees with it. It finds confirmed swing highs and lows, marks the bar that closes through one of them, and names that break as either a break of structure or a change of character. Around that core it draws the zone the break originated from, shades the part of the NSE trading day you are in, and grades the break against momentum read on the same timeframe.
How the structure engine works
Swing points are confirmed pivots found with TradingView's built-in pivot functions. A pivot high is recognised only after Swing Length bars have closed beyond it, so nothing is drawn before confirmation. Two passes run at once: a major pass at Swing Length, and a minor pass at Internal Length that describes the smaller swings inside the major ones.
When price closes through a confirmed swing point, the script labels it BOS if the break continues the prevailing direction, or CHoCH if it goes against it. CHoCH is the more informative of the two, since it is the first structural sign of a turn.
Order blocks
Rather than taking the extreme candle of the displacement leg, this script walks backwards from the breakout bar to the swing point it broke and takes the most recent candle that closed against the direction of the break. That candle's full range becomes the zone. Zones are removed on invalidation, either on a wick through the level or on a close beyond it, depending on the setting.
Fair value gaps and equal highs/lows
Fair value gaps are three-candle imbalances computed on the chart timeframe, filtered by a minimum size expressed in ATR. Equal highs and lows are consecutive swing points within an ATR-scaled tolerance, joined by a dotted line.
NSE session engine
On intraday charts the background is shaded by IST clock time into six windows: pre-open 09:00–09:15, opening drive 09:15–09:45, morning trend 09:45–11:30, lunch drift 11:30–13:30, afternoon 13:30–14:30, and power hour 14:30–15:30. Most structure tools shade London and New York hours, which describe a trading day unrelated to the NSE. The opening range high and low from the first N minutes are plotted for the rest of the session, and the overnight gap between the previous close and today's open is drawn as a zone that turns grey once filled.
Why RSI, MACD and EMAs are included
These are not signal generators here. They grade structure breaks. A change of character that fires while the higher timeframe, the EMA stack and MACD all disagree is a weaker event than the same break with all three behind it. The dashboard makes that difference visible in one place instead of requiring three additional panes. RSI, MACD and the EMAs 5/20/50 are all computed on the chart timeframe.
Dashboard
A two-column panel reporting swing trend, internal trend, higher-timeframe bias, the last structure event, the current session, RSI value with overbought/oversold tags, MACD direction, whether price sits above or below each of the three EMAs, VWAP side, overnight gap status, opening range, live order block and fair value gap counts, and a confluence count.
The confluence count
The bottom row counts how many of eight conditions currently agree with the swing trend: higher-timeframe bias, internal structure, the EMA stack, RSI side of 50, MACD, VWAP side, a live order block in direction, and whether the bar falls outside the lunch-drift window. This is a count of conditions that are true at this moment. It is not a probability, a win rate, or a forecast, and it should not be read as one. A low count usually means the chart is conflicted and there is no clean read available.
Settings worth knowing
Swing Length is the main control. Raise it on noisy charts before changing anything else. Internal structure can be switched off entirely if the chart feels crowded. Session tints, the opening range and the gap box switch themselves off above intraday timeframes, so the same script works on a daily equity chart without clutter.
Limitations
Confirmed pivots are recognised late by construction. With Swing Length at 10, a swing high is confirmed ten bars after it prints. The structure line is drawn back to where the pivot actually was, which can look like hindsight but is not, since nothing is drawn before confirmation.
In ranging markets, BOS and CHoCH alternate without much meaning. The equal-high and equal-low labels are usually the more honest reading there.
VWAP requires volume. Spot indices carry no volume on most feeds, so that row reads "no volume" and the corresponding confluence condition scores zero. Use the futures chart if VWAP matters to you.
The higher-timeframe bias is offset by one bar and requested with lookahead off. This is what prevents repainting, and it means the reading updates only when the higher-timeframe bar closes. It is the only higher-timeframe request in the script; everything else is computed on the chart timeframe.
Order block definitions vary between tools. The one used here is the last opposing candle before the move. Tools that use the extreme candle of the leg will draw different zones from identical price action. Neither definition is the correct one.
Credits
The visual language of market-structure indicators on TradingView was popularised by LuxAlgo's open-source Smart Money Concepts publication, which served as the reference for how this class of tool is presented on a chart. No code from that script is reused here — the structure engine is written from scratch on TradingView's built-in pivot functions, and the order block definition differs from that publication's approach.
Published open-source under the Mozilla Public License 2.0.
This indicator is educational. It is not investment advice, not a research recommendation, and not a solicitation to buy or sell any security.
Script open-source
Nello spirito di TradingView, l'autore di questo script lo ha reso open source, in modo che i trader possano esaminarne e verificarne la funzionalità. Complimenti all'autore! Sebbene sia possibile utilizzarlo gratuitamente, ricordiamo che la ripubblicazione del codice è soggetta al nostro Regolamento.

Declinazione di responsabilità
Le informazioni e le pubblicazioni non sono intese come, e non costituiscono, consulenza o raccomandazioni finanziarie, di investimento, di trading o di altro tipo fornite o approvate da TradingView. Per ulteriori informazioni, consultare i Termini di utilizzo.
Script open-source
Nello spirito di TradingView, l'autore di questo script lo ha reso open source, in modo che i trader possano esaminarne e verificarne la funzionalità. Complimenti all'autore! Sebbene sia possibile utilizzarlo gratuitamente, ricordiamo che la ripubblicazione del codice è soggetta al nostro Regolamento.
Declinazione di responsabilità
Le informazioni e le pubblicazioni non sono intese come, e non costituiscono, consulenza o raccomandazioni finanziarie, di investimento, di trading o di altro tipo fornite o approvate da TradingView. Per ulteriori informazioni, consultare i Termini di utilizzo.