OPEN-SOURCE SCRIPT
Aggiornato PremK | PUT & CALL Volume Profile Levels
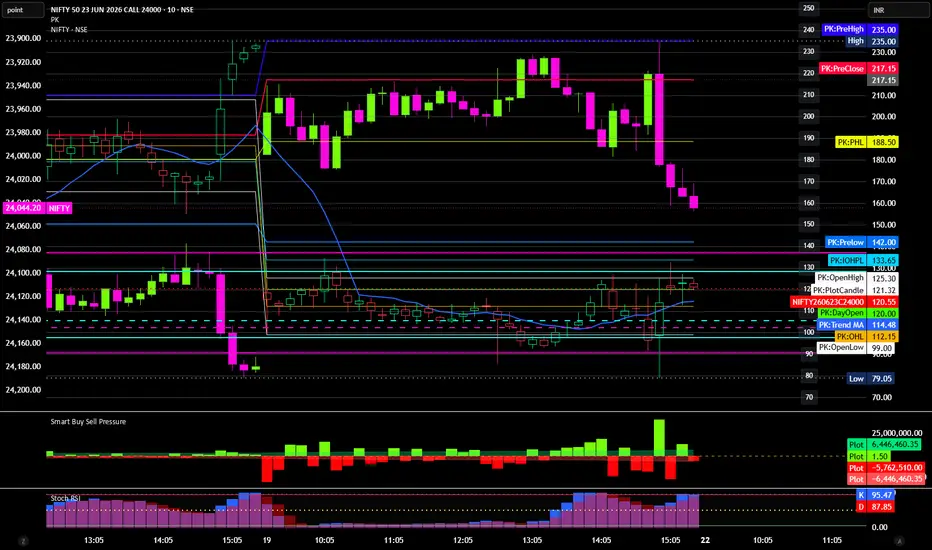
When traders refer to "PUT & CALL Volume Profile Levels," they are typically using specialized dual-profile indicators (such as the Wraith Protocol on TradingView) that apply the concepts of options market terminology to standard price-volume data.
Rather than plotting actual options contracts, these tools separate price action into two histograms: a "PUT" profile (analogous to deeper, longer-term support) and a "CALL" profile (analogous to shorter-term, bullish resistance).
Rather than plotting actual options contracts, these tools separate price action into two histograms: a "PUT" profile (analogous to deeper, longer-term support) and a "CALL" profile (analogous to shorter-term, bullish resistance).
Note di rilascio
Put/Call Volume Levels measure the balance between bearish "put" and bullish "call" options traded on the market. These levels are primarily used to gauge market sentiment and identify potential price reversals.Note di rilascio
Put & Call Volume Profile Levels means identifying the option strike prices where the highest trading volume has occurred.First Update Expiry date of Options, then choose the strike price that is what you want in the chart price(ex: NIFTY 23400) for the previous level, the average of call and put for the middle price in the meeting value.
Call (CE) Volume Levels:
High Call volume at a strike often indicates resistance.
Put (PE) Volume Levels:
High Put volume at a strike often indicates support.
Interpretation:
Highest CE Volume Strike → Potential Resistance
Highest PE Volume Strike → Potential Support
Price between these levels → Trading range
Break above major CE level → Bullish
Break below major PE level → Bearish
Note di rilascio
Happy day friends,Put & Call Volume Profile Levels means identifying the option strike prices where the highest trading volume has occurred.
{First Update Expiry date of Options, then choose the strike price that is what you want in the chart price(ex: NIFTY 23400) for the previous day level, the average of call and put closed price for the middle price in the meeting value at present.}
Call (CE) Volume Levels:
High Call volume at a strike often indicates resistance.
Put (PE) Volume Levels:
High Put volume at a strike often indicates support.
Interpretation:
Highest CE Volume Strike → Potential Resistance
Highest PE Volume Strike → Potential Support
Price between these levels → Trading range
Break above major CE level → Bullish
Break below major PE level → Bearish
Note di rilascio
Happy day friends,Put & Call Volume Profile Levels means identifying the option strike prices where the highest trading volume has occurred.
{First Update Expiry date of Options, then choose the strike price that is what you want in the chart price(ex: NIFTY 23400) for the previous day level, the average of call and put closed price for the middle price in the meeting value at present.}
Call (CE) Volume Levels:
High Call volume at a strike often indicates resistance.
Put (PE) Volume Levels:
High Put volume at a strike often indicates support.
Interpretation:
Highest CE Volume Strike → Potential Resistance
Highest PE Volume Strike → Potential Support
Price between these levels → Trading range
Break above major CE level → Bullish
Break below major PE level → Bearish
Note di rilascio
Happy day friends,Put & Call Volume Profile Levels means identifying the option strike prices where the highest trading volume has occurred.
{First Update Expiry date of Options, then choose the strike price that is what you want in the chart price(ex: NIFTY 23400) for the previous day level, the average of call and put closed price for the middle price in the meeting value at present.}
Call (CE) Volume Levels:
High Call volume at a strike often indicates resistance.
Put (PE) Volume Levels:
High Put volume at a strike often indicates support.
Interpretation:
Highest CE Volume Strike → Potential Resistance
Highest PE Volume Strike → Potential Support
Price between these levels → Trading range
Break above major CE level → Bullish
Break below major PE level → Bearish
Note di rilascio
Happy day friends,Put & Call Volume Profile Levels means identifying the option strike prices where the highest trading volume has occurred.
{First Update Expiry date(ex:260609) of Options, then choose the strike price that is what you want in the chart price(ex: NIFTY 23400 as CALL & PUT) for the previous day level close value, the average of call and put closed price for the middle price in the meeting value at present willbe act as center point of the day.}
Call (CE) Volume Levels:
High Call volume at a strike often indicates resistance.
Put (PE) Volume Levels:
High Put volume at a strike often indicates support.
Interpretation:
Highest CE Volume Strike → Potential Resistance
Highest PE Volume Strike → Potential Support
Price between these levels → Trading range
Break above major CE level → Bullish
Break below major PE level → Bearish
Note di rilascio
Happy day friends,Put & Call Volume Profile Levels means identifying the option strike prices where the highest trading volume has occurred.
Iam not a professional but , I share my learning and experience in this pinescript so i give in simple english
{First Update Expiry date(eg:260609)of Options, then choose the strike price that is what you want in the chart price(eg: NIFTY 23400) for the previous day level closing value, then the average of call and put closed price for the middle price (eg:nifty23400 @Rs.140 and nifty 23400 @Rs.160 closed price of the traded day, then the average of next day is (140+160=200, 200/2=100) in the meeting value at present in next day trading meeting area.}
Now I added control range candle in All time frames but enable only 15 minutes is better, other icons are unticked and then box icon/bar colour icon also in next page of indicator must untick to view better in chart.
In Strike settings - first page choose step points must 25 or 50 is better for premium price(eg: 25,50,75,100 likewise) buy enter place to visible easy. levels per side 50 ok, Strike mode must Exact strike price give accurate buy area.
Call (CE) Volume Levels:
High Call volume at a strike often indicates resistance.
Put (PE) Volume Levels:
High Put volume at a strike often indicates support.
Interpretation:
Highest CE Volume Strike → Potential Resistance
Highest PE Volume Strike → Potential Support
Price between these levels → Trading range
Break above major CE level → Bullish
Break below major PE level → Bearish
Note di rilascio
Happy day friends,Put & Call Volume Profile Levels means identifying the option strike prices where the highest trading volume has occurred.
{First Update Expiry date(eg:260616)of Options, then choose the strike price that is what you want in the chart price(eg: NIFTY 23400) for the previous day level closing value, then the average of call(CE) and put(PE) closed price for the middle price in the meeting value at present in next day trading meeting area.}
In Strike settings - first page choose step points must 25 or 50 is better for premium price(eg: 25,50,75,100 likewise) buy enter place to visible easy. levels per side 50 ok, Strike mode must Exact strike price give accurate buy area.
Call (CE) Volume Levels:
High Call volume at a strike often indicates resistance.
Put (PE) Volume Levels:
High Put volume at a strike often indicates support.
Interpretation:
Highest CE Volume Strike → Potential Resistance
Highest PE Volume Strike → Potential Support
Price between these levels → Trading range
Break above major CE level → Bullish
Break below major PE level → Bearish
Note di rilascio
Happy day friends,Put & Call Volume Profile Levels means identifying the option strike prices where the highest trading volume has occurred.
{First Update Expiry date(eg:260616)of Options, then choose the strike price that is what you want in the chart price(eg: NIFTY 23400) for the previous day level closing value, then the average of call(CE) and put(PE) closed price for the middle price in the meeting value at present in next day trading meeting area.}
In Strike settings - first page choose step points must 25 or 50 is better for premium price(eg: 25,50,75,100 likewise) buy enter place to visible easy. levels per side 50 ok, Strike mode must Exact strike price give accurate buy area.
Call (CE) Volume Levels:
High Call volume at a strike often indicates resistance.
Put (PE) Volume Levels:
High Put volume at a strike often indicates support.
Interpretation:
Highest CE Volume Strike → Potential Resistance
Highest PE Volume Strike → Potential Support
Price between these levels → Trading range
Break above major CE level → Bullish
Break below major PE level → Bearish
Note di rilascio
Happy day friends,Put & Call Volume Profile Levels means identifying the option strike prices where the highest trading volume has occurred.
{First Update Expiry date(eg:260609)of Options, then choose the strike price that is what you want in the chart price(eg: NIFTY 23400) for the previous day level closing value, then the average of call and put closed price for the middle price in the meeting value at present in next day trading meeting area.}
Now I added control dotted range (choose 20step) candle in All time frames but enable only 5 minutes is better, other icons are unticked and then box icon/bar colour icon also in next page of indicator must untick to view better in chart.
In Strike settings - first page choose step points must 20 is better for premium price(eg: 25,50,75,100 likewise) buy enter place to visible easy. levels per side 20 or 25 ok, Strike mode must Exact strike price give accurate buy area.
Call (CE) Volume Levels:
High Call volume at a strike often indicates resistance.
Put (PE) Volume Levels:
High Put volume at a strike often indicates support.
Interpretation:
Highest CE Volume Strike → Potential Resistance
Highest PE Volume Strike → Potential Support
Price between these levels → Trading range
Break above major CE level → Bullish
Break below major PE level → Bearish
Note di rilascio
Happy day friends,Put & Call Volume Profile Levels means identifying the option strike prices where the highest trading volume has occurred.
{First Update Expiry date(eg:260609)of Options, then choose the strike price that is what you want in the chart price(eg: NIFTY 23400) for the previous day level closing value, then the average of call and put closed price for the middle price in the meeting value at present in next day trading meeting area.}
Now I added control dotted range( 20 step enter) candle in All time frames but enable only 5 minutes is better, other icons are unticked and then box icon/bar colour icon also in next page of indicator must untick to view better in chart.
In Strike settings - first page choose step points must 20 or 25 is better for premium price(eg: 25,50,75,100 likewise) buy enter place to visible easy. levels per side 20 ok, Strike mode must Exact strike price give accurate buy area.
Call (CE) Volume Levels:
High Call volume at a strike often indicates resistance.
Put (PE) Volume Levels:
High Put volume at a strike often indicates support.
Interpretation:
Highest CE Volume Strike → Potential Resistance
Highest PE Volume Strike → Potential Support
Price between these levels → Trading range
Break above major CE level → Bullish
Break below major PE level → Bearish
Note di rilascio
Happy day friends,Put & Call Volume Profile Levels means identifying the option strike prices where the highest trading volume has occurred.
{First Update Expiry date(eg:260623)of Options, then choose the strike price that is what you want in the chart price(eg: NIFTY 23400) for the previous day level closing value, then the average of call and put closed price for the middle price in the meeting value at present in next day trading meeting area.}
Now I added control dotted range( 20 step enter) candle in All time frames but enable only 5 minutes is better, other icons are unticked and then box icon/bar colour icon also in next page of indicator must untick to view better in chart.
In Strike settings - first page choose step points must 20 or 25 is better for premium price(eg: 25,50,75,100 likewise) buy enter place to visible easy. levels per side 20 ok, Strike mode must Exact strike price give accurate buy area.
buy CE side area Call seller exit or Put buyer exit place as reverse to touch same wise
buy PE side area Put seller exit or Call buyer exit place as reverse to touch same wise
added hollow candles small size if want untick all chart given candles body, wick, border then only it shown better
Call (CE) Volume Levels:
High Call volume at a strike often indicates resistance.
Put (PE) Volume Levels:
High Put volume at a strike often indicates support.
Interpretation:
Highest CE Volume Strike → Potential Resistance
Highest PE Volume Strike → Potential Support
Price between these levels → Trading range
Break above major CE level → Bullish
Break below major PE level → Bearish
Note di rilascio
Happy day friends,Put & Call Volume Profile Levels means identifying the option strike prices where the highest trading volume has occurred.
Buy at bottom Green line area and sell it Top Green line area, But, my condition works when it first go down side of green line and expect to touch Pink line of bottom, then it reverse to green line area buy candle must close above the line then enter will decide. then the target up side green line first exit pount for safers, if want to hold wait for pink line in top. Entry at Green line above - stop loss is pink colour line
Now I added control dotted range (10 or 20 step enter) candle in all time frames but enable only 5 minutes is better, other icons are unticked and then box icon/bar colour icon also in next page of indicator must untick to view better in chart.
In Strike settings - first page choose step points must 10 or 20 is better for premium price (eg: 10,20,30..........100 likewise) buy enter place to visible easy, levels per side 10 or 20 ok, Strike mode must Exact strike price give accurate buy area.
Buy CE side area = Call seller exit or Put buyer exit place as reverse to touch same wise.
Buy PE side area = Put seller exit or Call buyer exit place as reverse to touch same wise.
Added hollow candles small size is add in my indicator, if want untick all spot chart given candles body, wick, border then only it shown better my hollow candles to visible easy.
Call (CE) Volume Levels:
High Call volume at a strike often indicates resistance.
Put (PE) Volume Levels:
High Put volume at a strike often indicates support.
Interpretation:
Highest CE Volume Strike → Potential Resistance
Highest PE Volume Strike → Potential Support
Price between these levels → Trading Range
Break above major CE level → Bullish
Break below major PE level → Bearish
This indicator is designed to identify important support and resistance zones using Call and Put option volume concentration at different strike prices.
Script open-source
Nello spirito di TradingView, l'autore di questo script lo ha reso open source, in modo che i trader possano esaminarne e verificarne la funzionalità. Complimenti all'autore! Sebbene sia possibile utilizzarlo gratuitamente, ricordiamo che la ripubblicazione del codice è soggetta al nostro Regolamento.

Declinazione di responsabilità
Le informazioni e le pubblicazioni non sono intese come, e non costituiscono, consulenza o raccomandazioni finanziarie, di investimento, di trading o di altro tipo fornite o approvate da TradingView. Per ulteriori informazioni, consultare i Termini di utilizzo.
Script open-source
Nello spirito di TradingView, l'autore di questo script lo ha reso open source, in modo che i trader possano esaminarne e verificarne la funzionalità. Complimenti all'autore! Sebbene sia possibile utilizzarlo gratuitamente, ricordiamo che la ripubblicazione del codice è soggetta al nostro Regolamento.
Declinazione di responsabilità
Le informazioni e le pubblicazioni non sono intese come, e non costituiscono, consulenza o raccomandazioni finanziarie, di investimento, di trading o di altro tipo fornite o approvate da TradingView. Per ulteriori informazioni, consultare i Termini di utilizzo.