Aggiornato
Zero Lag Liquidity [PIP REXA]
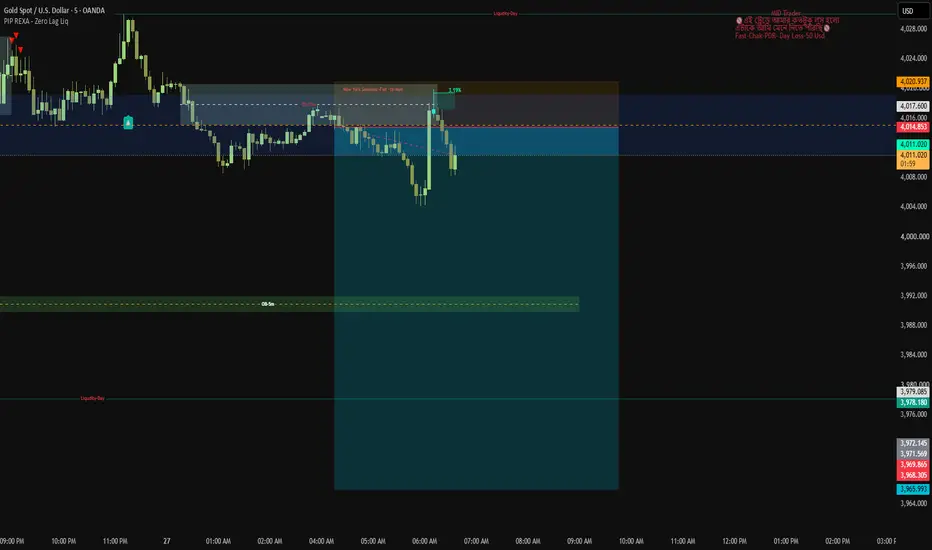
# Zero Lag Liquidity [PIP REXA]
**Advanced Liquidity Detection | Wick Volume Profile | Point of Control (POC) | Break & Rejection Signals**
## Overview
Zero Lag Liquidity [PIP REXA] is a technical analysis indicator designed to help traders identify potential liquidity levels using significant candlestick wicks, lower-timeframe volume data, and volume-based Point of Control (POC) calculations.
The indicator highlights potential areas of market interest, tracks liquidity levels, and provides visual signals when price breaks or rejects these levels.
It is designed to complement Price Action, Smart Money Concepts (SMC), and Market Structure analysis.
## Key Features
**1. Liquidity Level Detection**
Identifies significant wick events using relative volume strength and adjustable wick-size filtering.
**2. Wick Volume Profile & POC**
Uses lower-timeframe price and volume data to estimate the Point of Control within selected candle wicks.
**3. Bullish & Bearish Liquidity Levels**
Displays color-coded liquidity levels to help traders distinguish between bullish and bearish market conditions.
**4. Liquidity Strength Labels**
Shows the relative volume contribution of each active liquidity level as a percentage or displays its recorded volume.
**5. Liquidity Break Signals**
Highlights potential bullish and bearish liquidity breaks when price satisfies the indicator's level-breaking conditions.
**6. Liquidity Rejection Signals**
Identifies potential price rejections around active liquidity levels.
**7. Dynamic Trend Visualization**
Provides optional candle coloring based on the most recently detected liquidity break direction.
**8. Customizable Settings**
Allows traders to adjust lower-timeframe resolution, profile bin count, wick sensitivity, colors, label sizes, and signal visibility.
**9. TradingView Alerts**
Includes alert conditions for liquidity breaks, rejections, and bullish or bearish trend states.
## How to Use
1. Identify active liquidity levels displayed on the chart.
2. Observe the volume-strength labels to compare active levels.
3. Watch for potential liquidity breaks and rejection signals.
4. Confirm trading opportunities using Market Structure, Support & Resistance, and Price Action.
5. Apply appropriate Risk Management before entering any trade.
## Supported Markets
Forex | Gold (XAU/USD) | Indices | Cryptocurrency | Stocks
The indicator can be applied to different markets and timeframes, subject to the availability of suitable lower-timeframe price and volume data.
## Important Notes
- POC levels are estimated using lower-timeframe closing prices and reported volume, rather than a complete exchange order-book profile.
- Volume strength percentages represent the relative volume of active levels and do not indicate guaranteed buying or selling pressure.
- Signals may change while the current candle is forming.
- The indicator does not guarantee profitable trading outcomes.
## Risk Disclaimer
This indicator is intended for educational and technical analysis purposes only. It does not constitute financial advice or a recommendation to buy or sell any financial instrument.
Trading involves risk. Always use independent analysis, appropriate position sizing, and proper risk management.
**PIP REXA**
*PRECISION IN EVERY TRADE*
**Advanced Liquidity Detection | Wick Volume Profile | Point of Control (POC) | Break & Rejection Signals**
## Overview
Zero Lag Liquidity [PIP REXA] is a technical analysis indicator designed to help traders identify potential liquidity levels using significant candlestick wicks, lower-timeframe volume data, and volume-based Point of Control (POC) calculations.
The indicator highlights potential areas of market interest, tracks liquidity levels, and provides visual signals when price breaks or rejects these levels.
It is designed to complement Price Action, Smart Money Concepts (SMC), and Market Structure analysis.
## Key Features
**1. Liquidity Level Detection**
Identifies significant wick events using relative volume strength and adjustable wick-size filtering.
**2. Wick Volume Profile & POC**
Uses lower-timeframe price and volume data to estimate the Point of Control within selected candle wicks.
**3. Bullish & Bearish Liquidity Levels**
Displays color-coded liquidity levels to help traders distinguish between bullish and bearish market conditions.
**4. Liquidity Strength Labels**
Shows the relative volume contribution of each active liquidity level as a percentage or displays its recorded volume.
**5. Liquidity Break Signals**
Highlights potential bullish and bearish liquidity breaks when price satisfies the indicator's level-breaking conditions.
**6. Liquidity Rejection Signals**
Identifies potential price rejections around active liquidity levels.
**7. Dynamic Trend Visualization**
Provides optional candle coloring based on the most recently detected liquidity break direction.
**8. Customizable Settings**
Allows traders to adjust lower-timeframe resolution, profile bin count, wick sensitivity, colors, label sizes, and signal visibility.
**9. TradingView Alerts**
Includes alert conditions for liquidity breaks, rejections, and bullish or bearish trend states.
## How to Use
1. Identify active liquidity levels displayed on the chart.
2. Observe the volume-strength labels to compare active levels.
3. Watch for potential liquidity breaks and rejection signals.
4. Confirm trading opportunities using Market Structure, Support & Resistance, and Price Action.
5. Apply appropriate Risk Management before entering any trade.
## Supported Markets
Forex | Gold (XAU/USD) | Indices | Cryptocurrency | Stocks
The indicator can be applied to different markets and timeframes, subject to the availability of suitable lower-timeframe price and volume data.
## Important Notes
- POC levels are estimated using lower-timeframe closing prices and reported volume, rather than a complete exchange order-book profile.
- Volume strength percentages represent the relative volume of active levels and do not indicate guaranteed buying or selling pressure.
- Signals may change while the current candle is forming.
- The indicator does not guarantee profitable trading outcomes.
## Risk Disclaimer
This indicator is intended for educational and technical analysis purposes only. It does not constitute financial advice or a recommendation to buy or sell any financial instrument.
Trading involves risk. Always use independent analysis, appropriate position sizing, and proper risk management.
**PIP REXA**
*PRECISION IN EVERY TRADE*
Note di rilascio
# PIP REXA | Zero Lag Liquidity PRO — Updated Version**Advanced Liquidity Analysis | Wick Volume Profile | POC Levels | Volume Strength | Break & Rejection Signals**
## Overview
PIP REXA Zero Lag Liquidity PRO is an updated liquidity analysis indicator designed to identify significant candlestick wick activity, estimate volume-based Point of Control (POC) levels, and highlight potential liquidity breaks and rejections.
This updated version focuses on improved signal confirmation, more reliable volume calculations, optimized chart performance, and cleaner visual presentation.
The indicator is designed to support Price Action, Smart Money Concepts (SMC), Market Structure, and liquidity-based trading analysis.
## What's New in This Update?
**1. Improved Liquidity POC Calculation**
Enhanced the wick-based Point of Control calculation using lower-timeframe price and volume data to identify potential areas of concentrated trading activity.
**2. Improved Volume Strength Labels**
Updated the volume display system to provide clearer information about active liquidity levels.
- Relative volume strength displayed as a percentage.
- Optional absolute volume display.
- Improved percentage calculation.
- Customizable label sizes.
**3. Enhanced Liquidity Break Detection**
Refined bullish and bearish liquidity break conditions to improve signal consistency and visual clarity.
**4. Improved Liquidity Rejection Signals**
Updated rejection detection to highlight potential bullish and bearish price reactions around active liquidity levels.
**5. Candle-Close Confirmation Option**
Added an optional candle-close confirmation setting to reduce unconfirmed signals during live candle formation.
**6. Optimized Drawing Object Management**
Improved the handling of liquidity lines, labels, and filled zones.
- Automatic cleanup of outdated drawing objects.
- Better management of TradingView drawing limits.
- Reduced unnecessary chart clutter.
**7. Improved Trend Visualization**
Maintained dynamic candle coloring based on liquidity conditions, with updated trend-change alerts.
**8. Updated Indicator Branding**
Refined the indicator name and presentation under the PIP REXA brand.
## Main Features
- Bullish and Bearish Liquidity Levels
- Wick-Based Volume Profile
- Volume Point of Control (POC)
- Liquidity Strength Percentage
- Liquidity Break Signals
- Liquidity Rejection Signals
- Dynamic Trend Coloring
- Customizable Indicator Settings
- Candle-Close Confirmation Option
- TradingView Alert Conditions
## How to Use
1. Identify active bullish and bearish liquidity levels.
2. Observe the POC lines and volume-strength labels.
3. Monitor price reactions around significant liquidity areas.
4. Use break and rejection signals as additional confirmation.
5. Combine signals with Market Structure, Support & Resistance, and Price Action.
6. Apply appropriate Stop Loss placement and Risk Management.
## Supported Markets
Forex | Gold (XAU/USD) | Indices | Cryptocurrency | Stocks
Results depend on the availability and quality of lower-timeframe price and volume data.
## Important Information
POC levels are estimates derived from lower-timeframe price and volume information, not direct order-book measurements.
Candle-close confirmation can reduce intrabar signal changes but does not guarantee that every signal will be accurate or profitable.
## Risk Disclaimer
This indicator is provided for educational and technical analysis purposes only. It does not constitute financial or investment advice.
Trading financial markets involves risk. Always conduct independent analysis and use proper risk management.
---
**PIP REXA**
*PRECISION IN EVERY TRADE*

Declinazione di responsabilità
Le informazioni e le pubblicazioni non sono intese come, e non costituiscono, consulenza o raccomandazioni finanziarie, di investimento, di trading o di altro tipo fornite o approvate da TradingView. Per ulteriori informazioni, consultare i Termini di utilizzo.
Declinazione di responsabilità
Le informazioni e le pubblicazioni non sono intese come, e non costituiscono, consulenza o raccomandazioni finanziarie, di investimento, di trading o di altro tipo fornite o approvate da TradingView. Per ulteriori informazioni, consultare i Termini di utilizzo.