Daily Open Gap Zones
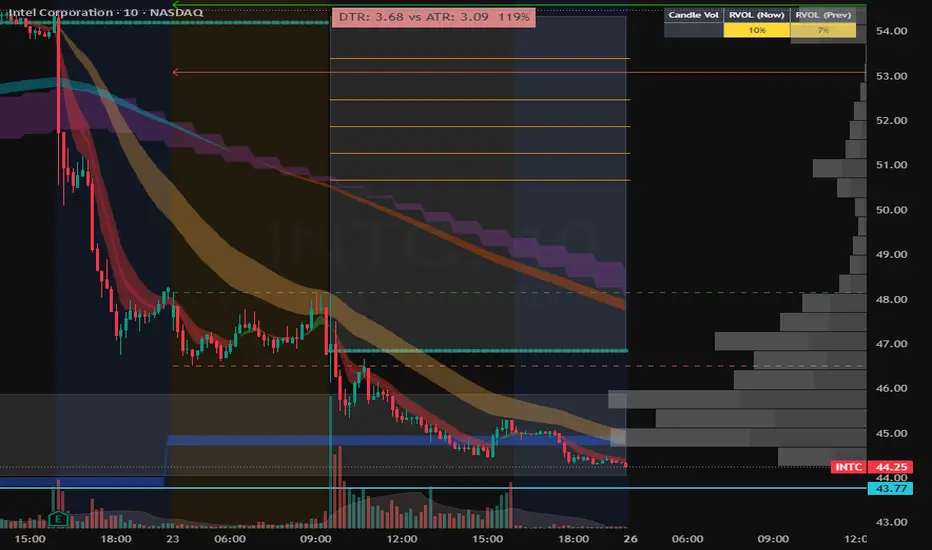
This indicator highlights Daily Opening Gaps by drawing a zone between the previous regular session close and the next regular session open (RTH). Each gap is displayed as a light white filled box with a dotted, transparent white border and is extended forward in time until it is considered filled.
How it works
Gap Definition:
A gap is created when today’s regular-session open is different from yesterday’s regular-session close.
Zone Range:
The gap zone is the price range between those two values.
Unfilled Gaps Only:
The box stays on the chart until the gap is filled, then it is removed.
Fill Mode Options:
Full fill: gap is removed only when price reaches the far edge of the gap zone.
Touch (enter zone): gap is removed as soon as price trades into the gap zone.
Min Gap Size (ticks):
Filters out tiny gaps. A gap is plotted only if
abs(open - prior close) >= minGapTicks × syminfo.mintick.
Best use case
Designed for intraday traders (e.g., 10-minute charts) who want to quickly see open/unfilled daily gaps that may act as support/resistance or mean-reversion targets.

Declinazione di responsabilità
Le informazioni e le pubblicazioni non sono intese come, e non costituiscono, consulenza o raccomandazioni finanziarie, di investimento, di trading o di altro tipo fornite o approvate da TradingView. Per ulteriori informazioni, consultare i Termini di utilizzo.
Declinazione di responsabilità
Le informazioni e le pubblicazioni non sono intese come, e non costituiscono, consulenza o raccomandazioni finanziarie, di investimento, di trading o di altro tipo fornite o approvate da TradingView. Per ulteriori informazioni, consultare i Termini di utilizzo.