OPEN-SOURCE SCRIPT
Aggiornato Earnings and Sales Acceleration [skm]
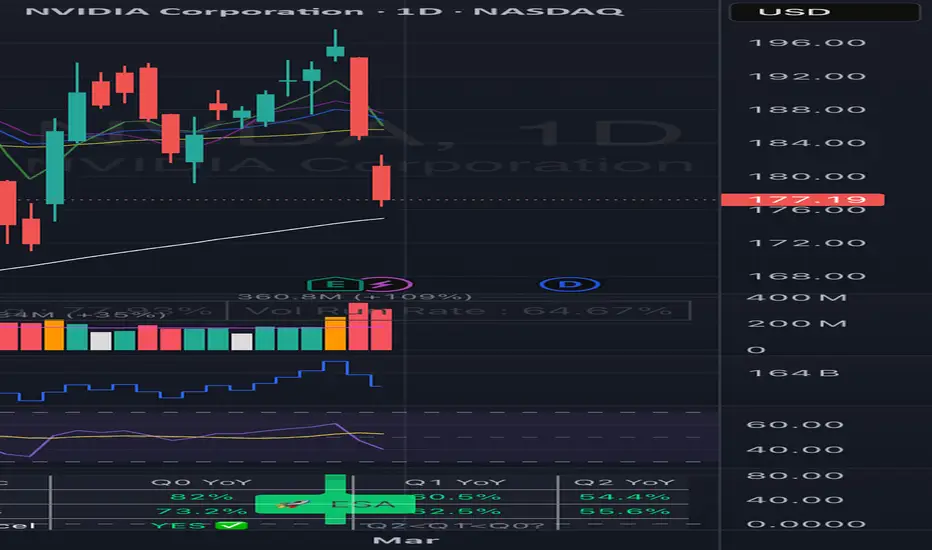
Earnings & Sales Acceleration (ESA)
Identifies stocks where both EPS and revenue growth are accelerating over three consecutive quarters on a year-over-year basis -- the "second derivative" of earnings growth popularised by investors like Stanley Druckenmiller. The idea is that a company posting an increasing YoY growth rate each quarter is building fundamental momentum the market often underestimates.
HOW ACCELERATION IS DEFINED
EPS Acceleration: YoY EPS growth must be strictly increasing across three consecutive quarters -- Q2 < Q1 < Q0 (oldest to newest). Each quarter is compared to the same quarter one year prior (4 earnings events back).
Revenue Acceleration: Same logic applied to YoY revenue growth. For newly listed stocks with limited history, TradingView's pre-calculated REVENUE_ONE_YEAR_GROWTH field is used as a fallback.
Strong Signal: Triggered only when both EPS and Revenue are simultaneously accelerating. This dual confirmation reduces false positives.
WHAT IS PLOTTED
- EPS YoY% columns at each earnings bar. Green = EPS accelerating, Red = not.
- Sales YoY% columns at each earnings bar. Green = Sales accelerating, Red = not.
- ESA label above the bar on a Strong Acceleration signal.
- DEC label below the bar on a Strong Deceleration signal.
- All visuals appear only at earnings event bars, keeping the chart clean.
A summary table in the top-right shows Q0, Q1, Q2 YoY growth for both EPS and Sales, plus YES/NO acceleration status and the overall signal.
HOW TO USE IN PINE SCREENER
The indicator exposes three screener outputs:
"Accel Signal = 1" -- Both EPS and Revenue accelerating for 3 consecutive quarters (strictest filter).
"EPS Accel Signal = 1" -- EPS alone accelerating for 3 consecutive quarters.
"Rev Accel Signal = 1" -- Revenue alone accelerating for 3 consecutive quarters.
To use: open the Stock Screener, click Filters, scroll to Add Indicator, search for "Earnings & Sales Acceleration" and add it. Set your chosen condition to = 1.
For best results, combine with additional filters such as minimum market cap, average volume above 500K, and a trend condition (e.g. price above the 50-week EMA) to ensure chart structure supports the fundamental thesis.
ALERTS
Two alert conditions are included: Strong Dual Acceleration (both metrics accelerating) and Strong Dual Deceleration (both decelerating). Set these via right-click on the indicator name.
LIMITATIONS
- Requires TradingView fundamental data. Not available for ETFs, indices, forex or crypto.
- Stocks with fewer than 6 quarters of history will show N/A for EPS acceleration.
- When the prior year quarter had negative EPS, YoY percentages should be interpreted with caution.
- Best viewed on Weekly charts to align with the quarterly earnings cadence.
Identifies stocks where both EPS and revenue growth are accelerating over three consecutive quarters on a year-over-year basis -- the "second derivative" of earnings growth popularised by investors like Stanley Druckenmiller. The idea is that a company posting an increasing YoY growth rate each quarter is building fundamental momentum the market often underestimates.
HOW ACCELERATION IS DEFINED
EPS Acceleration: YoY EPS growth must be strictly increasing across three consecutive quarters -- Q2 < Q1 < Q0 (oldest to newest). Each quarter is compared to the same quarter one year prior (4 earnings events back).
Revenue Acceleration: Same logic applied to YoY revenue growth. For newly listed stocks with limited history, TradingView's pre-calculated REVENUE_ONE_YEAR_GROWTH field is used as a fallback.
Strong Signal: Triggered only when both EPS and Revenue are simultaneously accelerating. This dual confirmation reduces false positives.
WHAT IS PLOTTED
- EPS YoY% columns at each earnings bar. Green = EPS accelerating, Red = not.
- Sales YoY% columns at each earnings bar. Green = Sales accelerating, Red = not.
- ESA label above the bar on a Strong Acceleration signal.
- DEC label below the bar on a Strong Deceleration signal.
- All visuals appear only at earnings event bars, keeping the chart clean.
A summary table in the top-right shows Q0, Q1, Q2 YoY growth for both EPS and Sales, plus YES/NO acceleration status and the overall signal.
HOW TO USE IN PINE SCREENER
The indicator exposes three screener outputs:
"Accel Signal = 1" -- Both EPS and Revenue accelerating for 3 consecutive quarters (strictest filter).
"EPS Accel Signal = 1" -- EPS alone accelerating for 3 consecutive quarters.
"Rev Accel Signal = 1" -- Revenue alone accelerating for 3 consecutive quarters.
To use: open the Stock Screener, click Filters, scroll to Add Indicator, search for "Earnings & Sales Acceleration" and add it. Set your chosen condition to = 1.
For best results, combine with additional filters such as minimum market cap, average volume above 500K, and a trend condition (e.g. price above the 50-week EMA) to ensure chart structure supports the fundamental thesis.
ALERTS
Two alert conditions are included: Strong Dual Acceleration (both metrics accelerating) and Strong Dual Deceleration (both decelerating). Set these via right-click on the indicator name.
LIMITATIONS
- Requires TradingView fundamental data. Not available for ETFs, indices, forex or crypto.
- Stocks with fewer than 6 quarters of history will show N/A for EPS acceleration.
- When the prior year quarter had negative EPS, YoY percentages should be interpreted with caution.
- Best viewed on Weekly charts to align with the quarterly earnings cadence.
Note di rilascio
Earnings & Sales Acceleration (ESA)Identifies stocks where both EPS and revenue growth are accelerating over three consecutive quarters on a year-over-year basis -- the "second derivative" of earnings growth popularised by investors like Stanley Druckenmiller. The idea is that a company posting an increasing YoY growth rate each quarter is building fundamental momentum the market often underestimates.
HOW ACCELERATION IS DEFINED
EPS Acceleration: YoY EPS growth must be strictly increasing across three consecutive quarters -- Q2 < Q1 < Q0 (oldest to newest). Each quarter is compared to the same quarter one year prior (4 earnings events back).
Revenue Acceleration: Same logic applied to YoY revenue growth. For newly listed stocks with limited history, TradingView's pre-calculated REVENUE_ONE_YEAR_GROWTH field is used as a fallback.
Strong Signal: Triggered only when both EPS and Revenue are simultaneously accelerating. This dual confirmation reduces false positives.
WHAT IS PLOTTED
- EPS YoY% columns at each earnings bar. Green = EPS accelerating, Red = not.
- Sales YoY% columns at each earnings bar. Green = Sales accelerating, Red = not.
- ESA label above the bar on a Strong Acceleration signal.
- DEC label below the bar on a Strong Deceleration signal.
- All visuals appear only at earnings event bars, keeping the chart clean.
A summary table in the top-right shows Q0, Q1, Q2 YoY growth for both EPS and Sales, plus YES/NO acceleration status and the overall signal.
HOW TO USE IN PINE SCREENER
The indicator exposes three screener outputs:
"Accel Signal = 1" -- Both EPS and Revenue accelerating for 3 consecutive quarters (strictest filter).
"EPS Accel Signal = 1" -- EPS alone accelerating for 3 consecutive quarters.
"Rev Accel Signal = 1" -- Revenue alone accelerating for 3 consecutive quarters.
To use: open the Stock Screener, click Filters, scroll to Add Indicator, search for "Earnings & Sales Acceleration" and add it. Set your chosen condition to = 1.
For best results, combine with additional filters such as minimum market cap, average volume above 500K, and a trend condition (e.g. price above the 50-week EMA) to ensure chart structure supports the fundamental thesis.
ALERTS
Two alert conditions are included: Strong Dual Acceleration (both metrics accelerating) and Strong Dual Deceleration (both decelerating). Set these via right-click on the indicator name.
LIMITATIONS
- Requires TradingView fundamental data. Not available for ETFs, indices, forex or crypto.
- Stocks with fewer than 6 quarters of history will show N/A for EPS acceleration.
- When the prior year quarter had negative EPS, YoY percentages should be interpreted with caution.
- Best viewed on Weekly charts to align with the quarterly earnings cadence.
Script open-source
Nello spirito di TradingView, l'autore di questo script lo ha reso open source, in modo che i trader possano esaminarne e verificarne la funzionalità. Complimenti all'autore! Sebbene sia possibile utilizzarlo gratuitamente, ricordiamo che la ripubblicazione del codice è soggetta al nostro Regolamento.

Declinazione di responsabilità
Le informazioni e le pubblicazioni non sono intese come, e non costituiscono, consulenza o raccomandazioni finanziarie, di investimento, di trading o di altro tipo fornite o approvate da TradingView. Per ulteriori informazioni, consultare i Termini di utilizzo.
Script open-source
Nello spirito di TradingView, l'autore di questo script lo ha reso open source, in modo che i trader possano esaminarne e verificarne la funzionalità. Complimenti all'autore! Sebbene sia possibile utilizzarlo gratuitamente, ricordiamo che la ripubblicazione del codice è soggetta al nostro Regolamento.
Declinazione di responsabilità
Le informazioni e le pubblicazioni non sono intese come, e non costituiscono, consulenza o raccomandazioni finanziarie, di investimento, di trading o di altro tipo fornite o approvate da TradingView. Per ulteriori informazioni, consultare i Termini di utilizzo.