OPEN-SOURCE SCRIPT
Aggiornato BNC Market Bias Dashboard
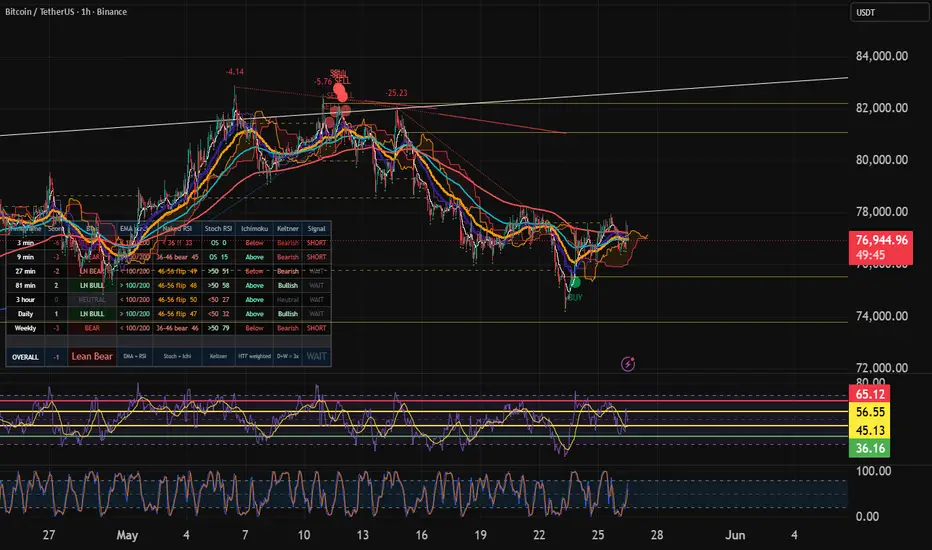
A multi-timeframe sentiment gauge built on the BullNaked Crypto strategy framework. No signals, no entries — just a clear read of where the market stands right now across 7 timeframes simultaneously.
Scores each timeframe (3min, 9min, 27min, 81min, 3H, Daily, Weekly) across 5 indicators — EMA stack, Naked RSI zones, Stochastic RSI, Ichimoku Cloud, and Keltner Channel — and combines them into a weighted overall bias rating. Higher timeframes carry more weight because the higher the timeframe, the stronger the signal.
Rating scale: Strong Bull → Bull → Lean Bull → Neutral → Lean Bear → Bear → Strong Bear
What each column shows:
EMA stack alignment (9/30/50/100/200)
Naked RSI health zone (36 / 46 / 56 / 65 system)
Stochastic RSI position
Ichimoku Cloud position
Keltner Channel position
Per-timeframe signal suggestion
The overall score is weighted so Daily and Weekly carry 3× the influence of the 3-minute, reflecting the core principle that trend is truth on the higher timeframe. Use this to build your story before placing any trade — if the higher timeframes disagree with your entry timeframe, the story isn't complete yet.
Overlays directly on your chart. Table anchors to the bottom-left corner. All timeframes and indicator settings are fully adjustable in the settings panel.
Not financial advice. For educational and informational purposes only.
Scores each timeframe (3min, 9min, 27min, 81min, 3H, Daily, Weekly) across 5 indicators — EMA stack, Naked RSI zones, Stochastic RSI, Ichimoku Cloud, and Keltner Channel — and combines them into a weighted overall bias rating. Higher timeframes carry more weight because the higher the timeframe, the stronger the signal.
Rating scale: Strong Bull → Bull → Lean Bull → Neutral → Lean Bear → Bear → Strong Bear
What each column shows:
EMA stack alignment (9/30/50/100/200)
Naked RSI health zone (36 / 46 / 56 / 65 system)
Stochastic RSI position
Ichimoku Cloud position
Keltner Channel position
Per-timeframe signal suggestion
The overall score is weighted so Daily and Weekly carry 3× the influence of the 3-minute, reflecting the core principle that trend is truth on the higher timeframe. Use this to build your story before placing any trade — if the higher timeframes disagree with your entry timeframe, the story isn't complete yet.
Overlays directly on your chart. Table anchors to the bottom-left corner. All timeframes and indicator settings are fully adjustable in the settings panel.
Not financial advice. For educational and informational purposes only.
Note di rilascio
Here's a clean description you can paste directly into TradingView:BNC Market Bias Dashboard v2.3
Multi-timeframe bias scoring system across 7 timeframes (3m through Weekly), weighted toward higher timeframes. Each timeframe scores 5 indicators — EMA stack, RSI, Stochastic RSI, Ichimoku, and Keltner Channel — producing a combined score from −10 to +10. Results display in a colour-coded dashboard table.
v2.3 adds: Confirmed BUY / SELL signals
Signals require two independent conditions to align:
Bias score crossover — the weighted overall score recovers from a bear extreme (BUY) or rolls over from a bull extreme (SELL), using a mean-reversion crossover rather than a static level read.
Trendline break confirmation — price breaks above an active downtrend line (BUY) or below an active uptrendline (SELL), using LuxAlgo's trendline engine based on pivot highs and lows.
A full-brightness dot prints when the score crossover fires within an active trendline break window. A faded dot prints when the trendline breaks while a recent score crossover is still valid. Window length, score threshold, swing length, and angle filters are all adjustable in settings.
Trendline logic adapted from LuxAlgo Trend Lines © LuxAlgo — CC BY-NC-SA 4.0
Script open-source
Nello spirito di TradingView, l'autore di questo script lo ha reso open source, in modo che i trader possano esaminarne e verificarne la funzionalità. Complimenti all'autore! Sebbene sia possibile utilizzarlo gratuitamente, ricordiamo che la ripubblicazione del codice è soggetta al nostro Regolamento.

Declinazione di responsabilità
Le informazioni e le pubblicazioni non sono intese come, e non costituiscono, consulenza o raccomandazioni finanziarie, di investimento, di trading o di altro tipo fornite o approvate da TradingView. Per ulteriori informazioni, consultare i Termini di utilizzo.
Script open-source
Nello spirito di TradingView, l'autore di questo script lo ha reso open source, in modo che i trader possano esaminarne e verificarne la funzionalità. Complimenti all'autore! Sebbene sia possibile utilizzarlo gratuitamente, ricordiamo che la ripubblicazione del codice è soggetta al nostro Regolamento.
Declinazione di responsabilità
Le informazioni e le pubblicazioni non sono intese come, e non costituiscono, consulenza o raccomandazioni finanziarie, di investimento, di trading o di altro tipo fornite o approvate da TradingView. Per ulteriori informazioni, consultare i Termini di utilizzo.